Overview
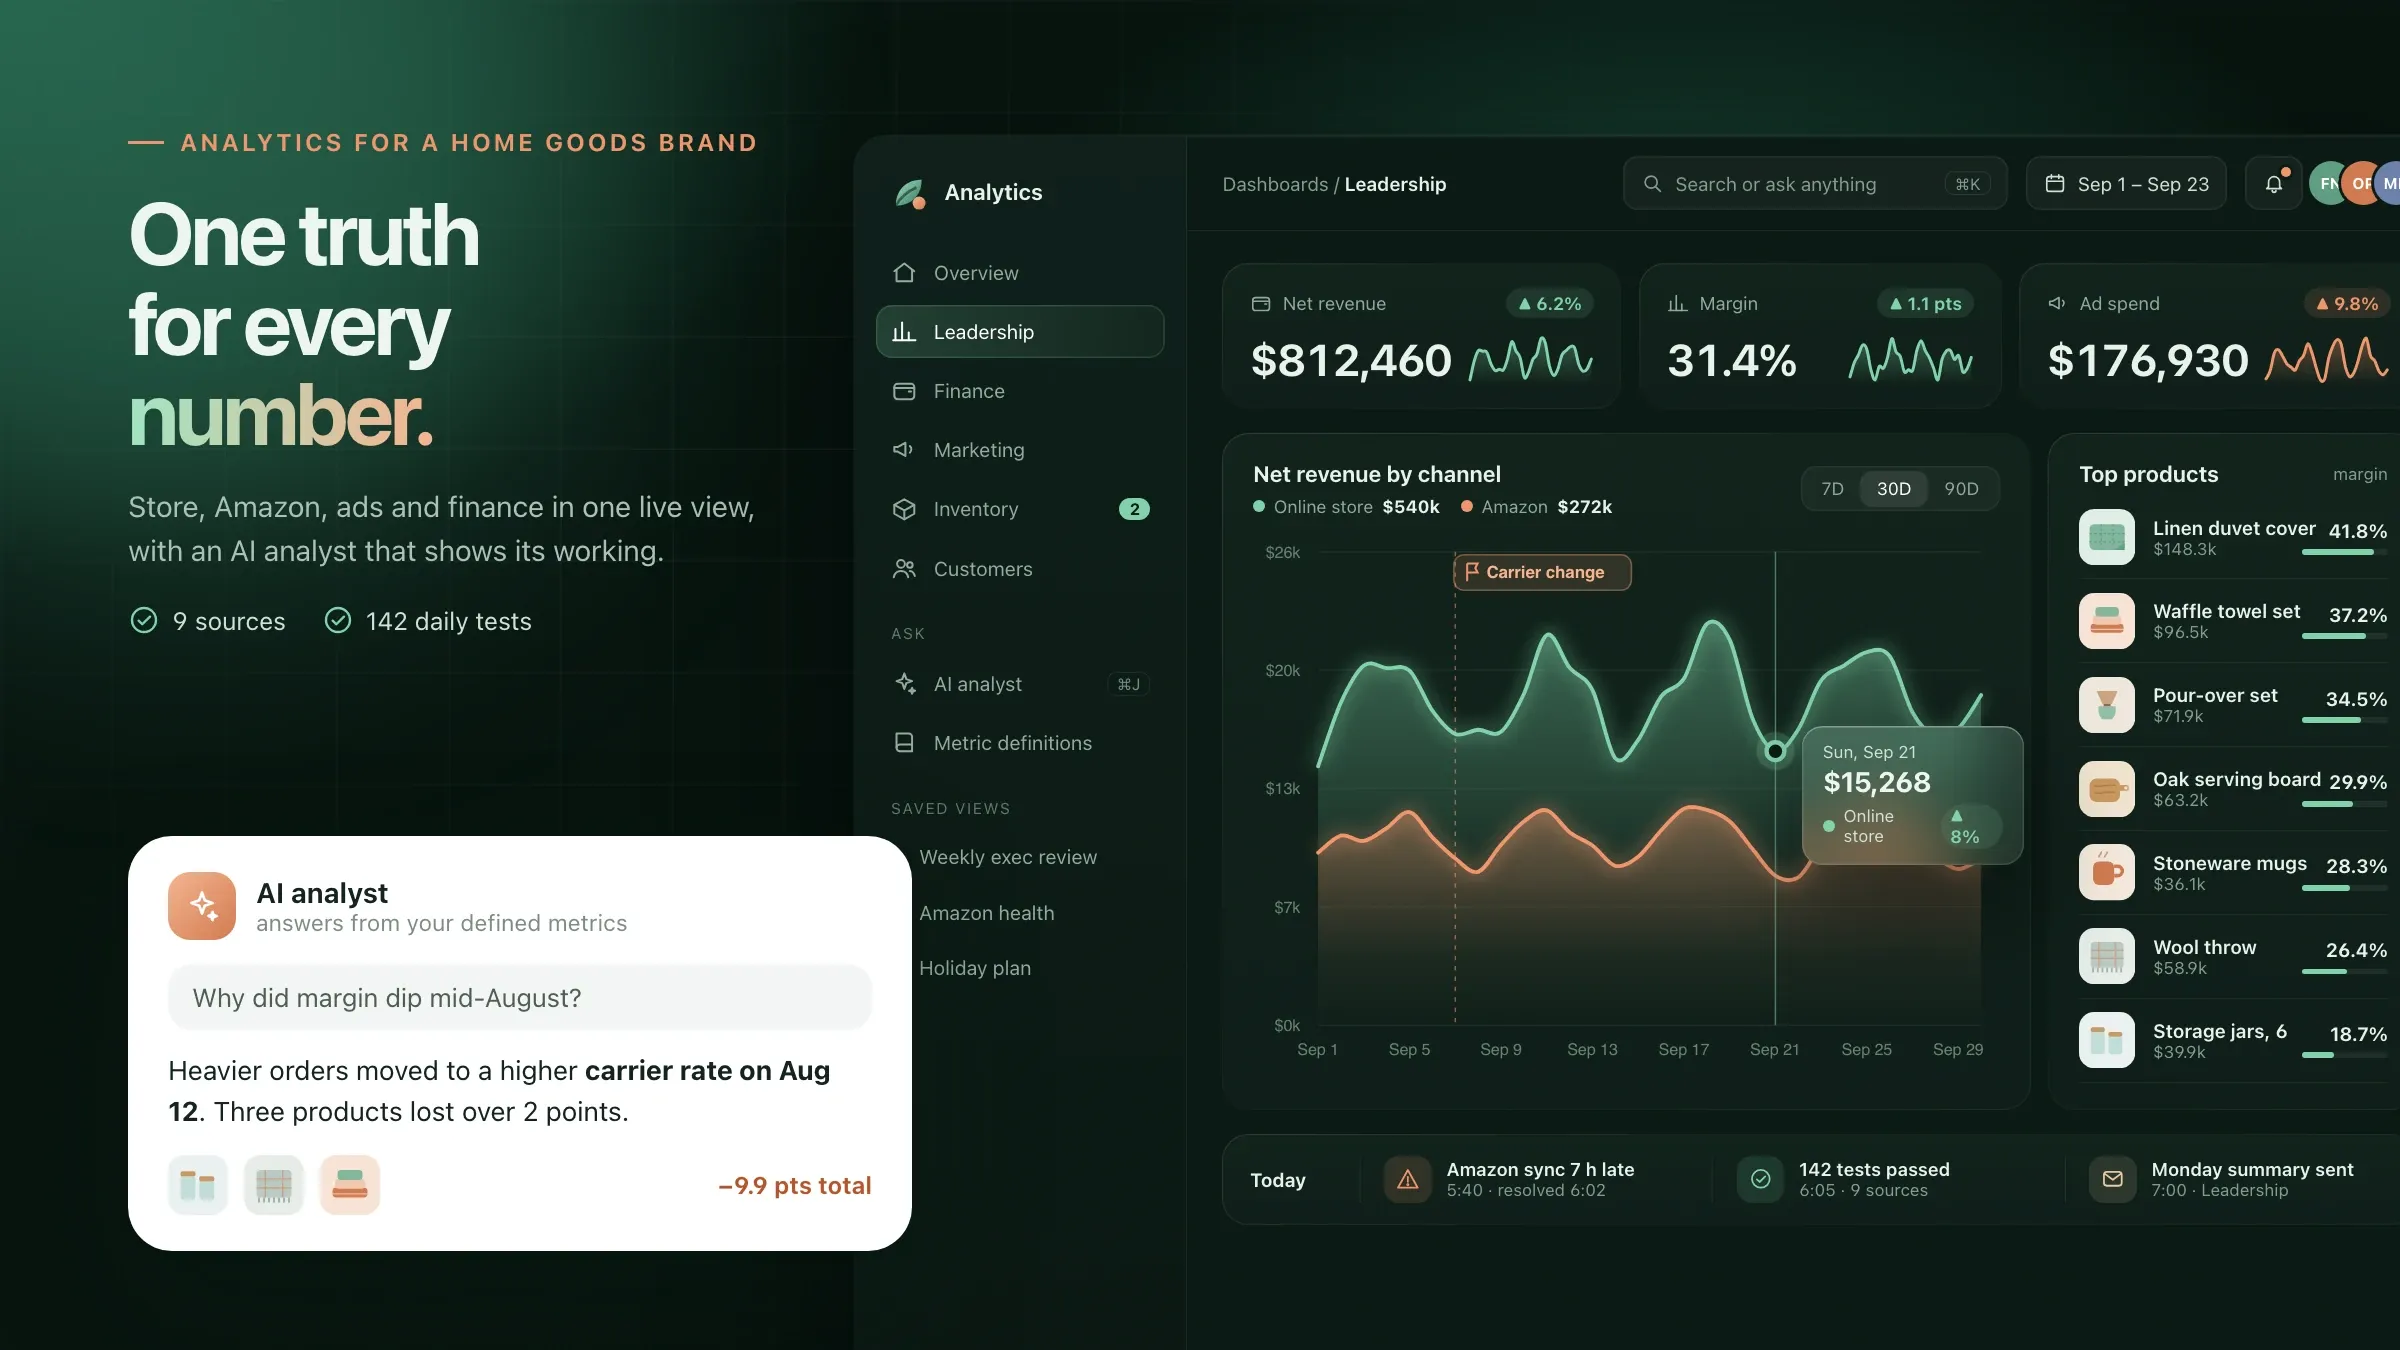
Business intelligence dashboards for an e-commerce brand: store, Amazon, ads and accounting data in one place, with AI answers to questions in plain English.
- Client
- A home goods e-commerce brand in Denver
- Industry
- E-commerce
- Location
- Denver, Colorado, United States
- Year
- 2026
- Duration
- 3 months
At a glance
- The challenge
The brand's numbers lived in eight places, and they never agreed.
- Metrics first
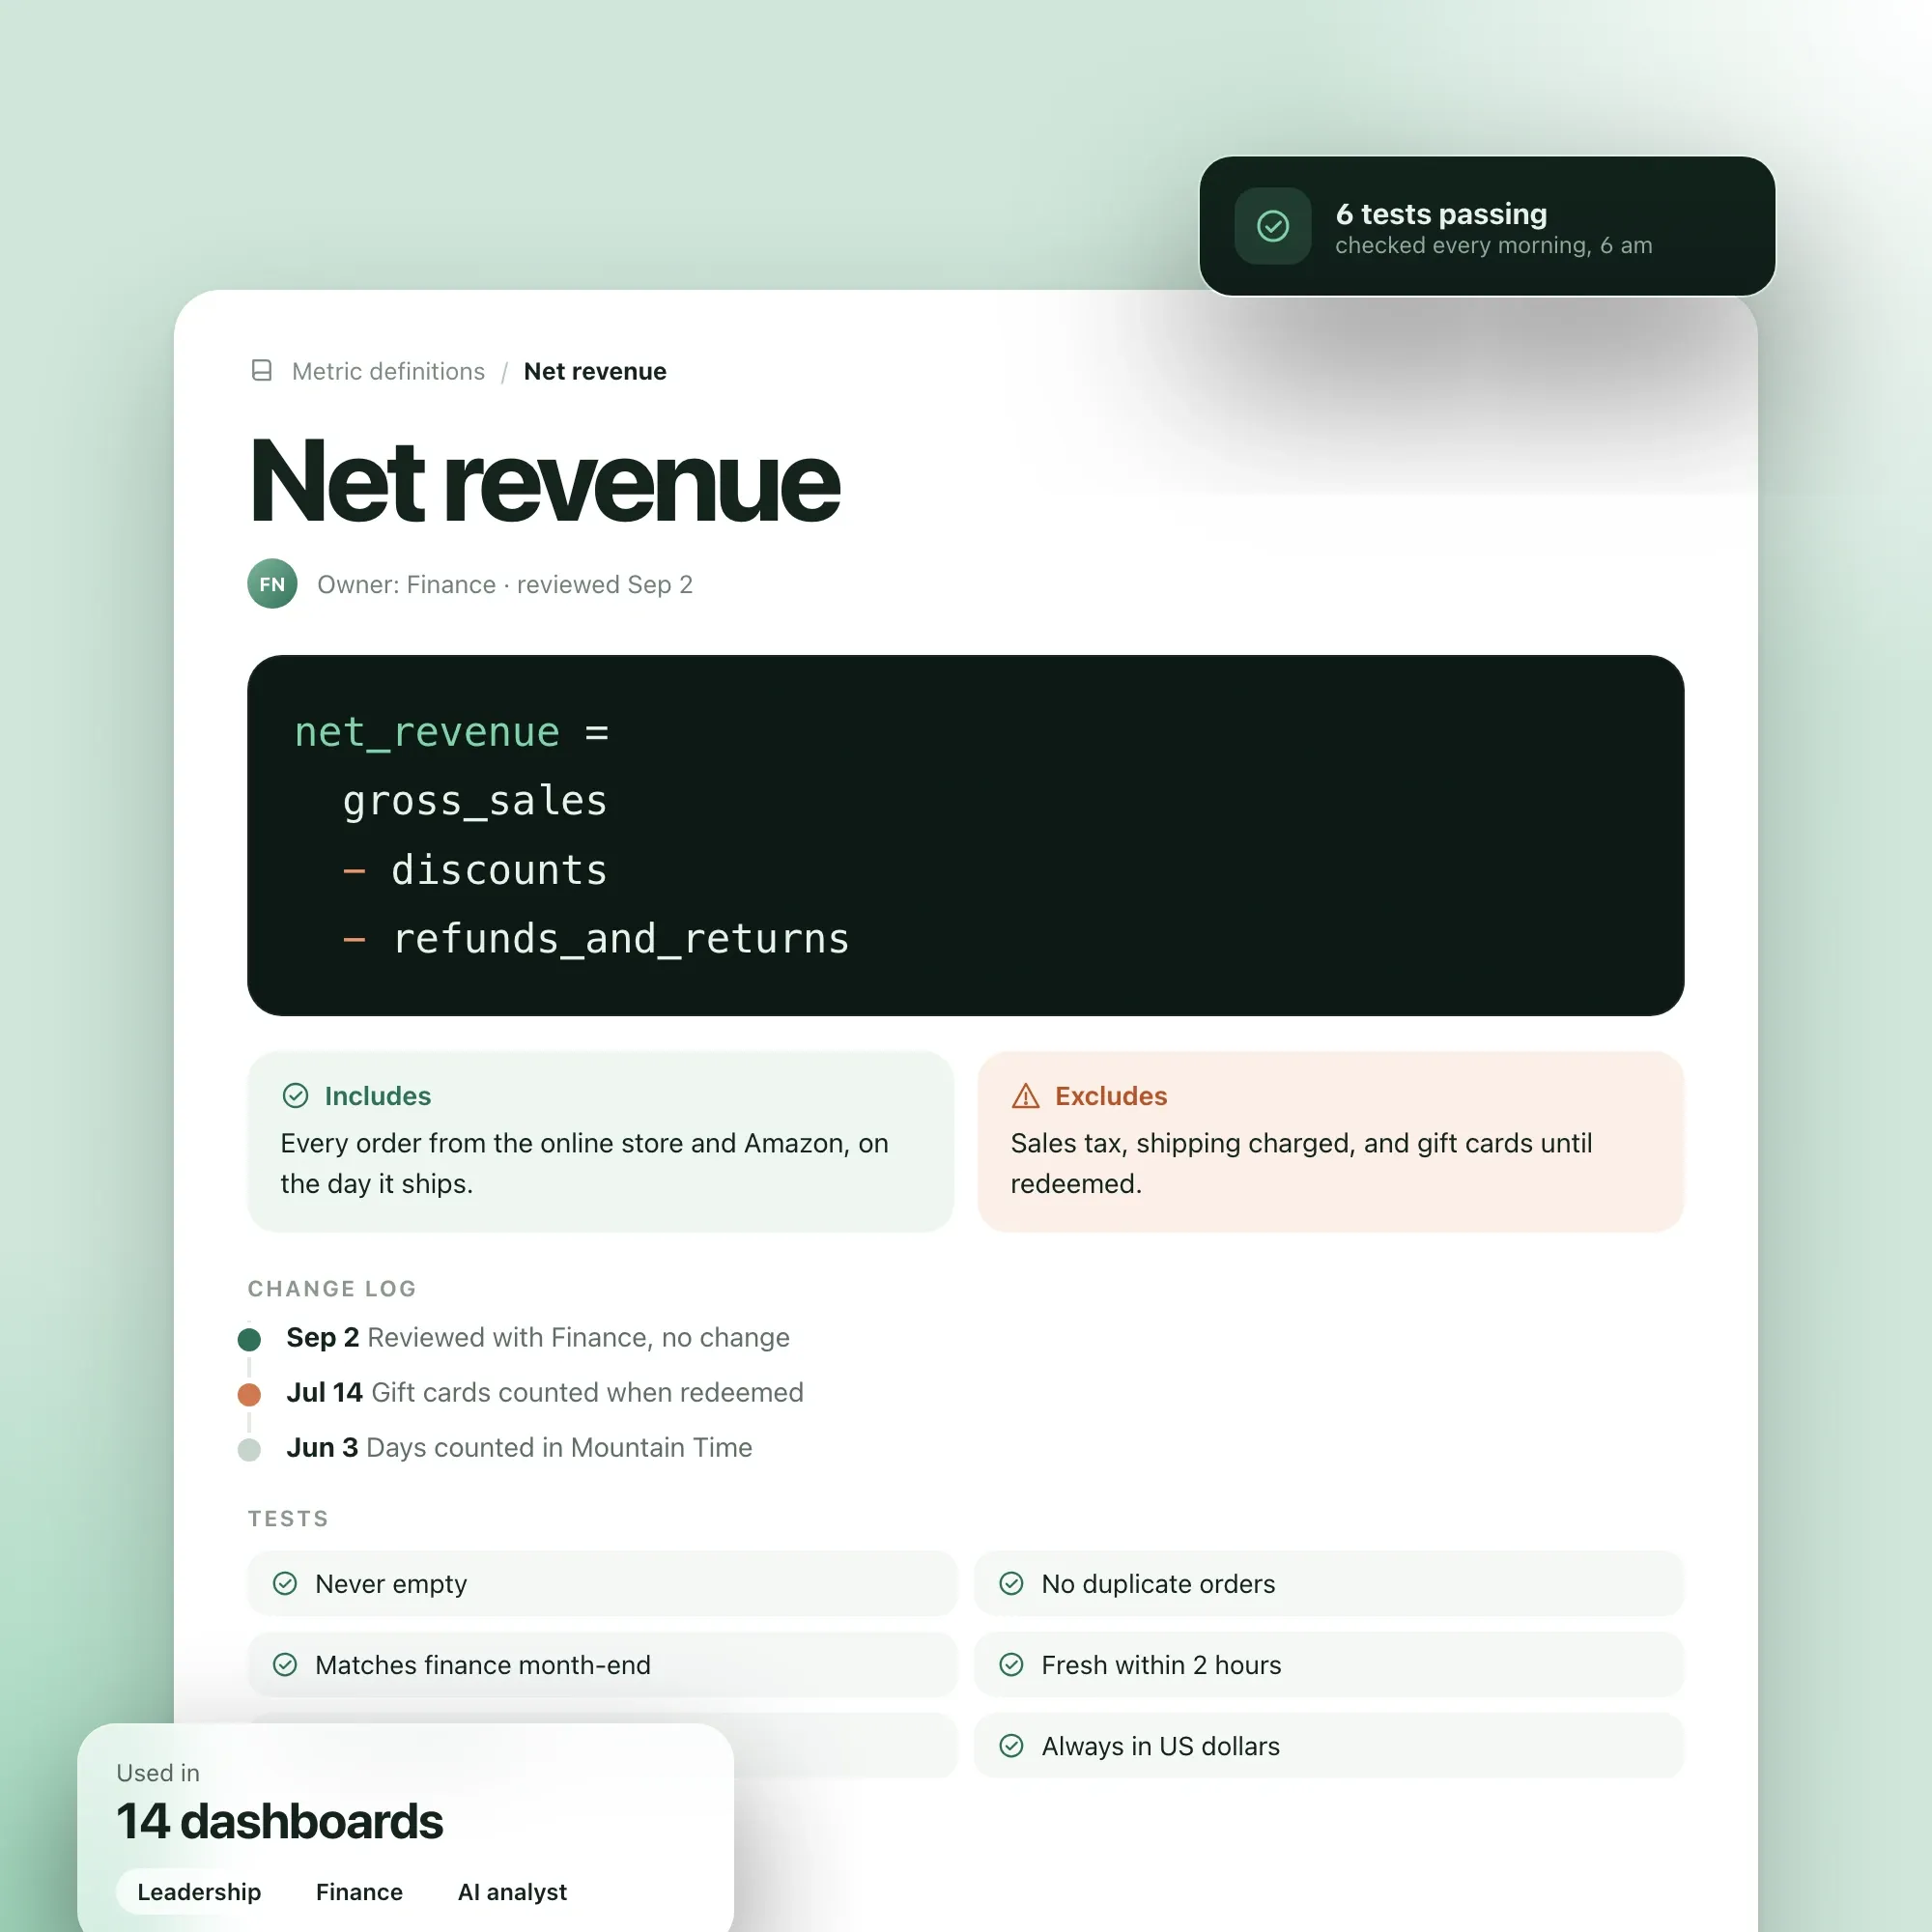
Before connecting a single source, we agreed what each number means.
- The data pipeline
The pipeline syncs every source into one BigQuery warehouse automatically: the online store, Amazon, Google Ads, Meta Ads, email, Google Analytics, the warehouse system and the accounting software.
- One definition for every number
On top of the raw data, dbt models turn each agreed definition into code, once.
- Dashboards for every team
Each team has dashboards built around its own decisions:
- Inventory and reorder alerts
Stock cover is calculated for every product, in the warehouse and at Amazon, from recent sales and each supplier's lead time.
- The AI analyst
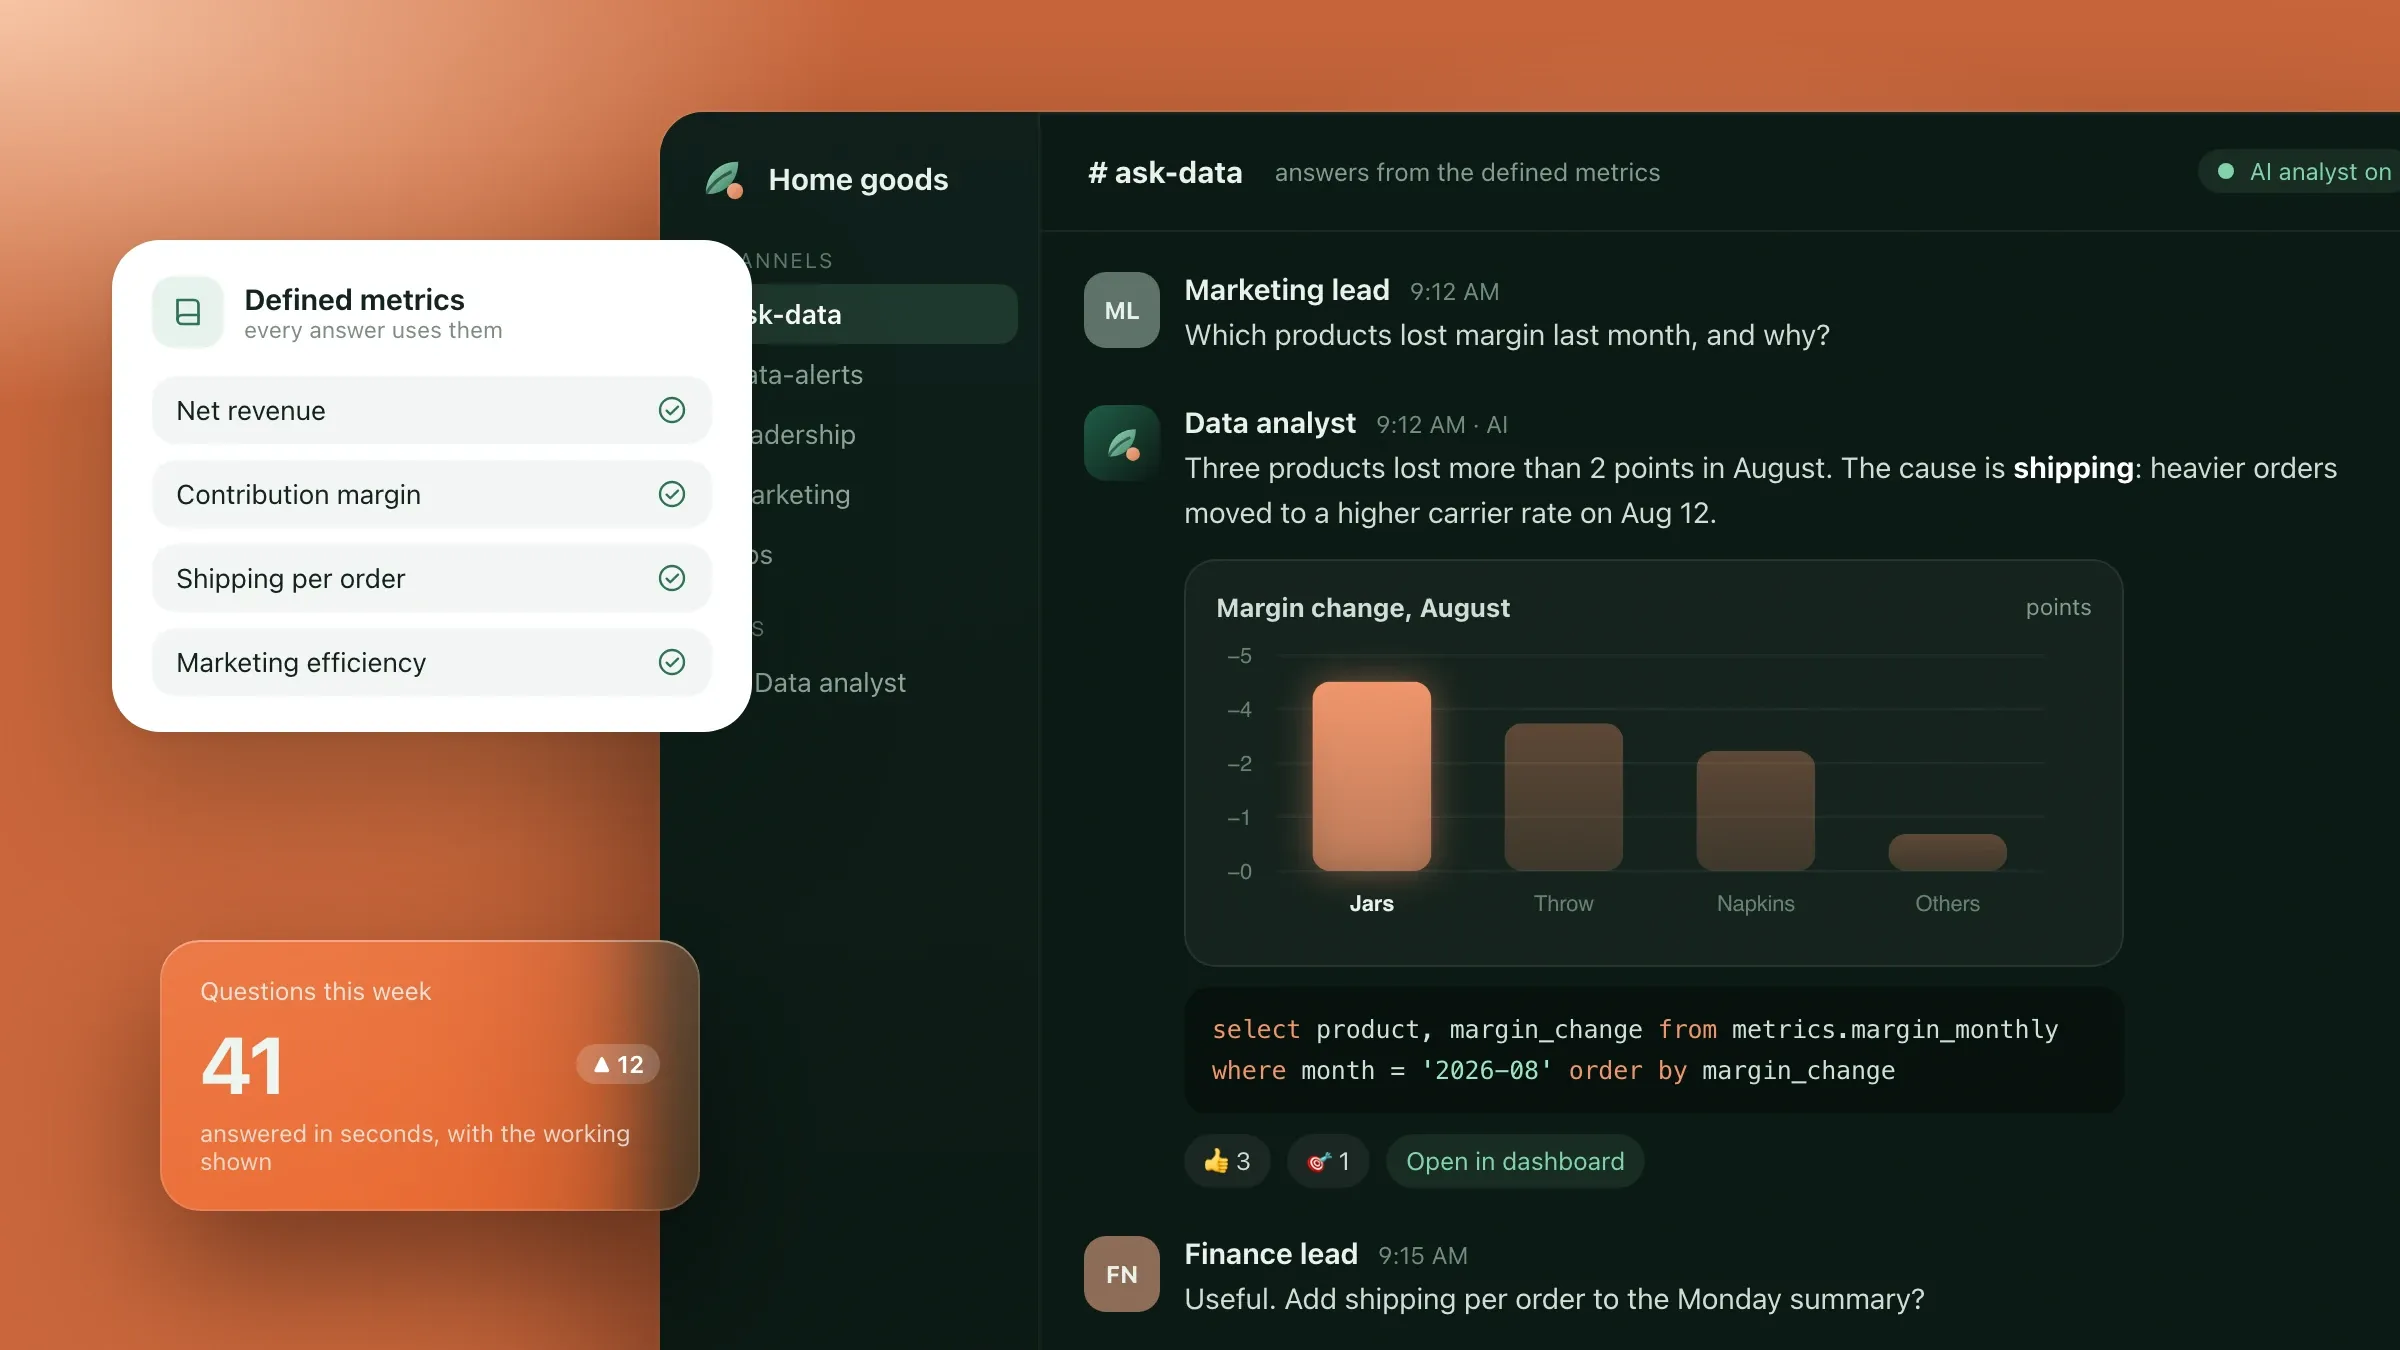
Anyone in the company can ask a question in plain English, in Slack or in the dashboards: which products lost margin last month and why, or how the spring sale compared with last year's.
- How it's built
Airbyte syncs every source into BigQuery, dbt builds and tests the models, and Metabase serves the dashboards.
- The outcome
The Monday spreadsheet has been retired, and every team now works from the same numbers.
The challenge
The brand’s numbers lived in eight places, and they never agreed. It sells home goods on its own online store and on Amazon, and its data was spread across the store, Amazon Seller Central, Google Ads, Meta Ads, its email tool, Google Analytics, the warehouse system and the accounting software.
Every Monday morning someone exported files and rebuilt the same spreadsheet. The figures rarely matched, because each tool counted revenue, refunds, discounts and even days differently. Nobody could see true profit per product after ads, fees, shipping and returns. Amazon stock-outs were spotted after sales had stopped, and leadership questions waited in a queue for the one analyst.
Metrics first
Before connecting a single source, we agreed what each number means. Two weeks of interviews with leadership, marketing, operations and finance produced one written definition for every metric the business runs on, including:
- net revenue: after discounts, refunds and returns, not before;
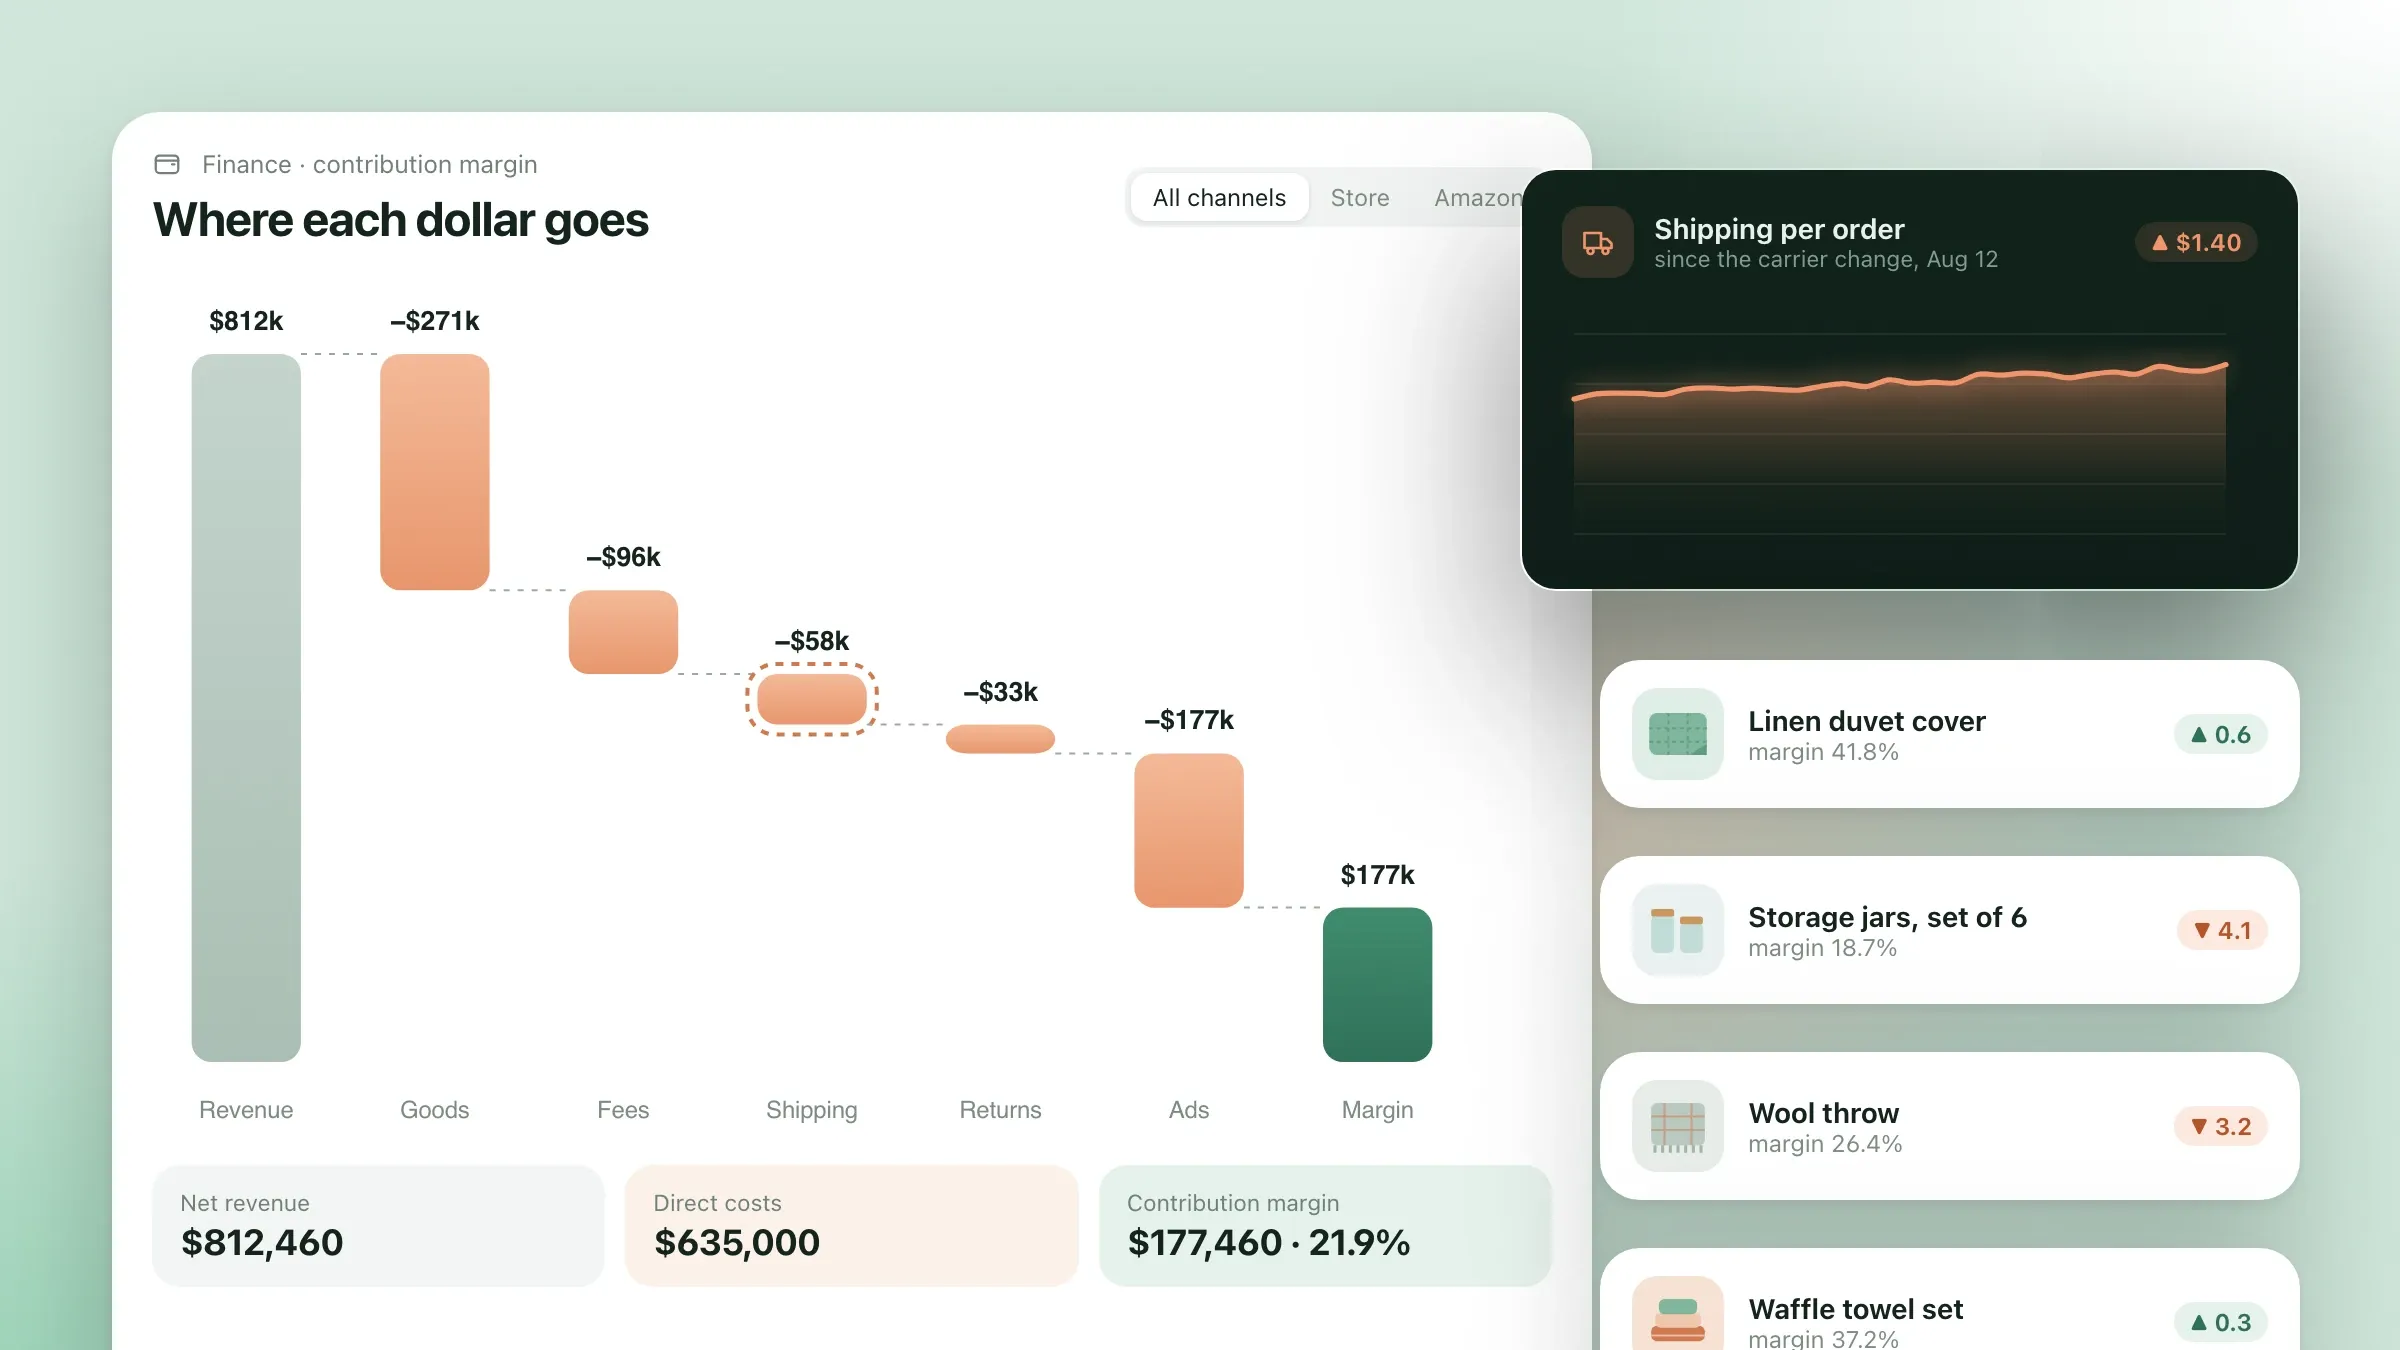
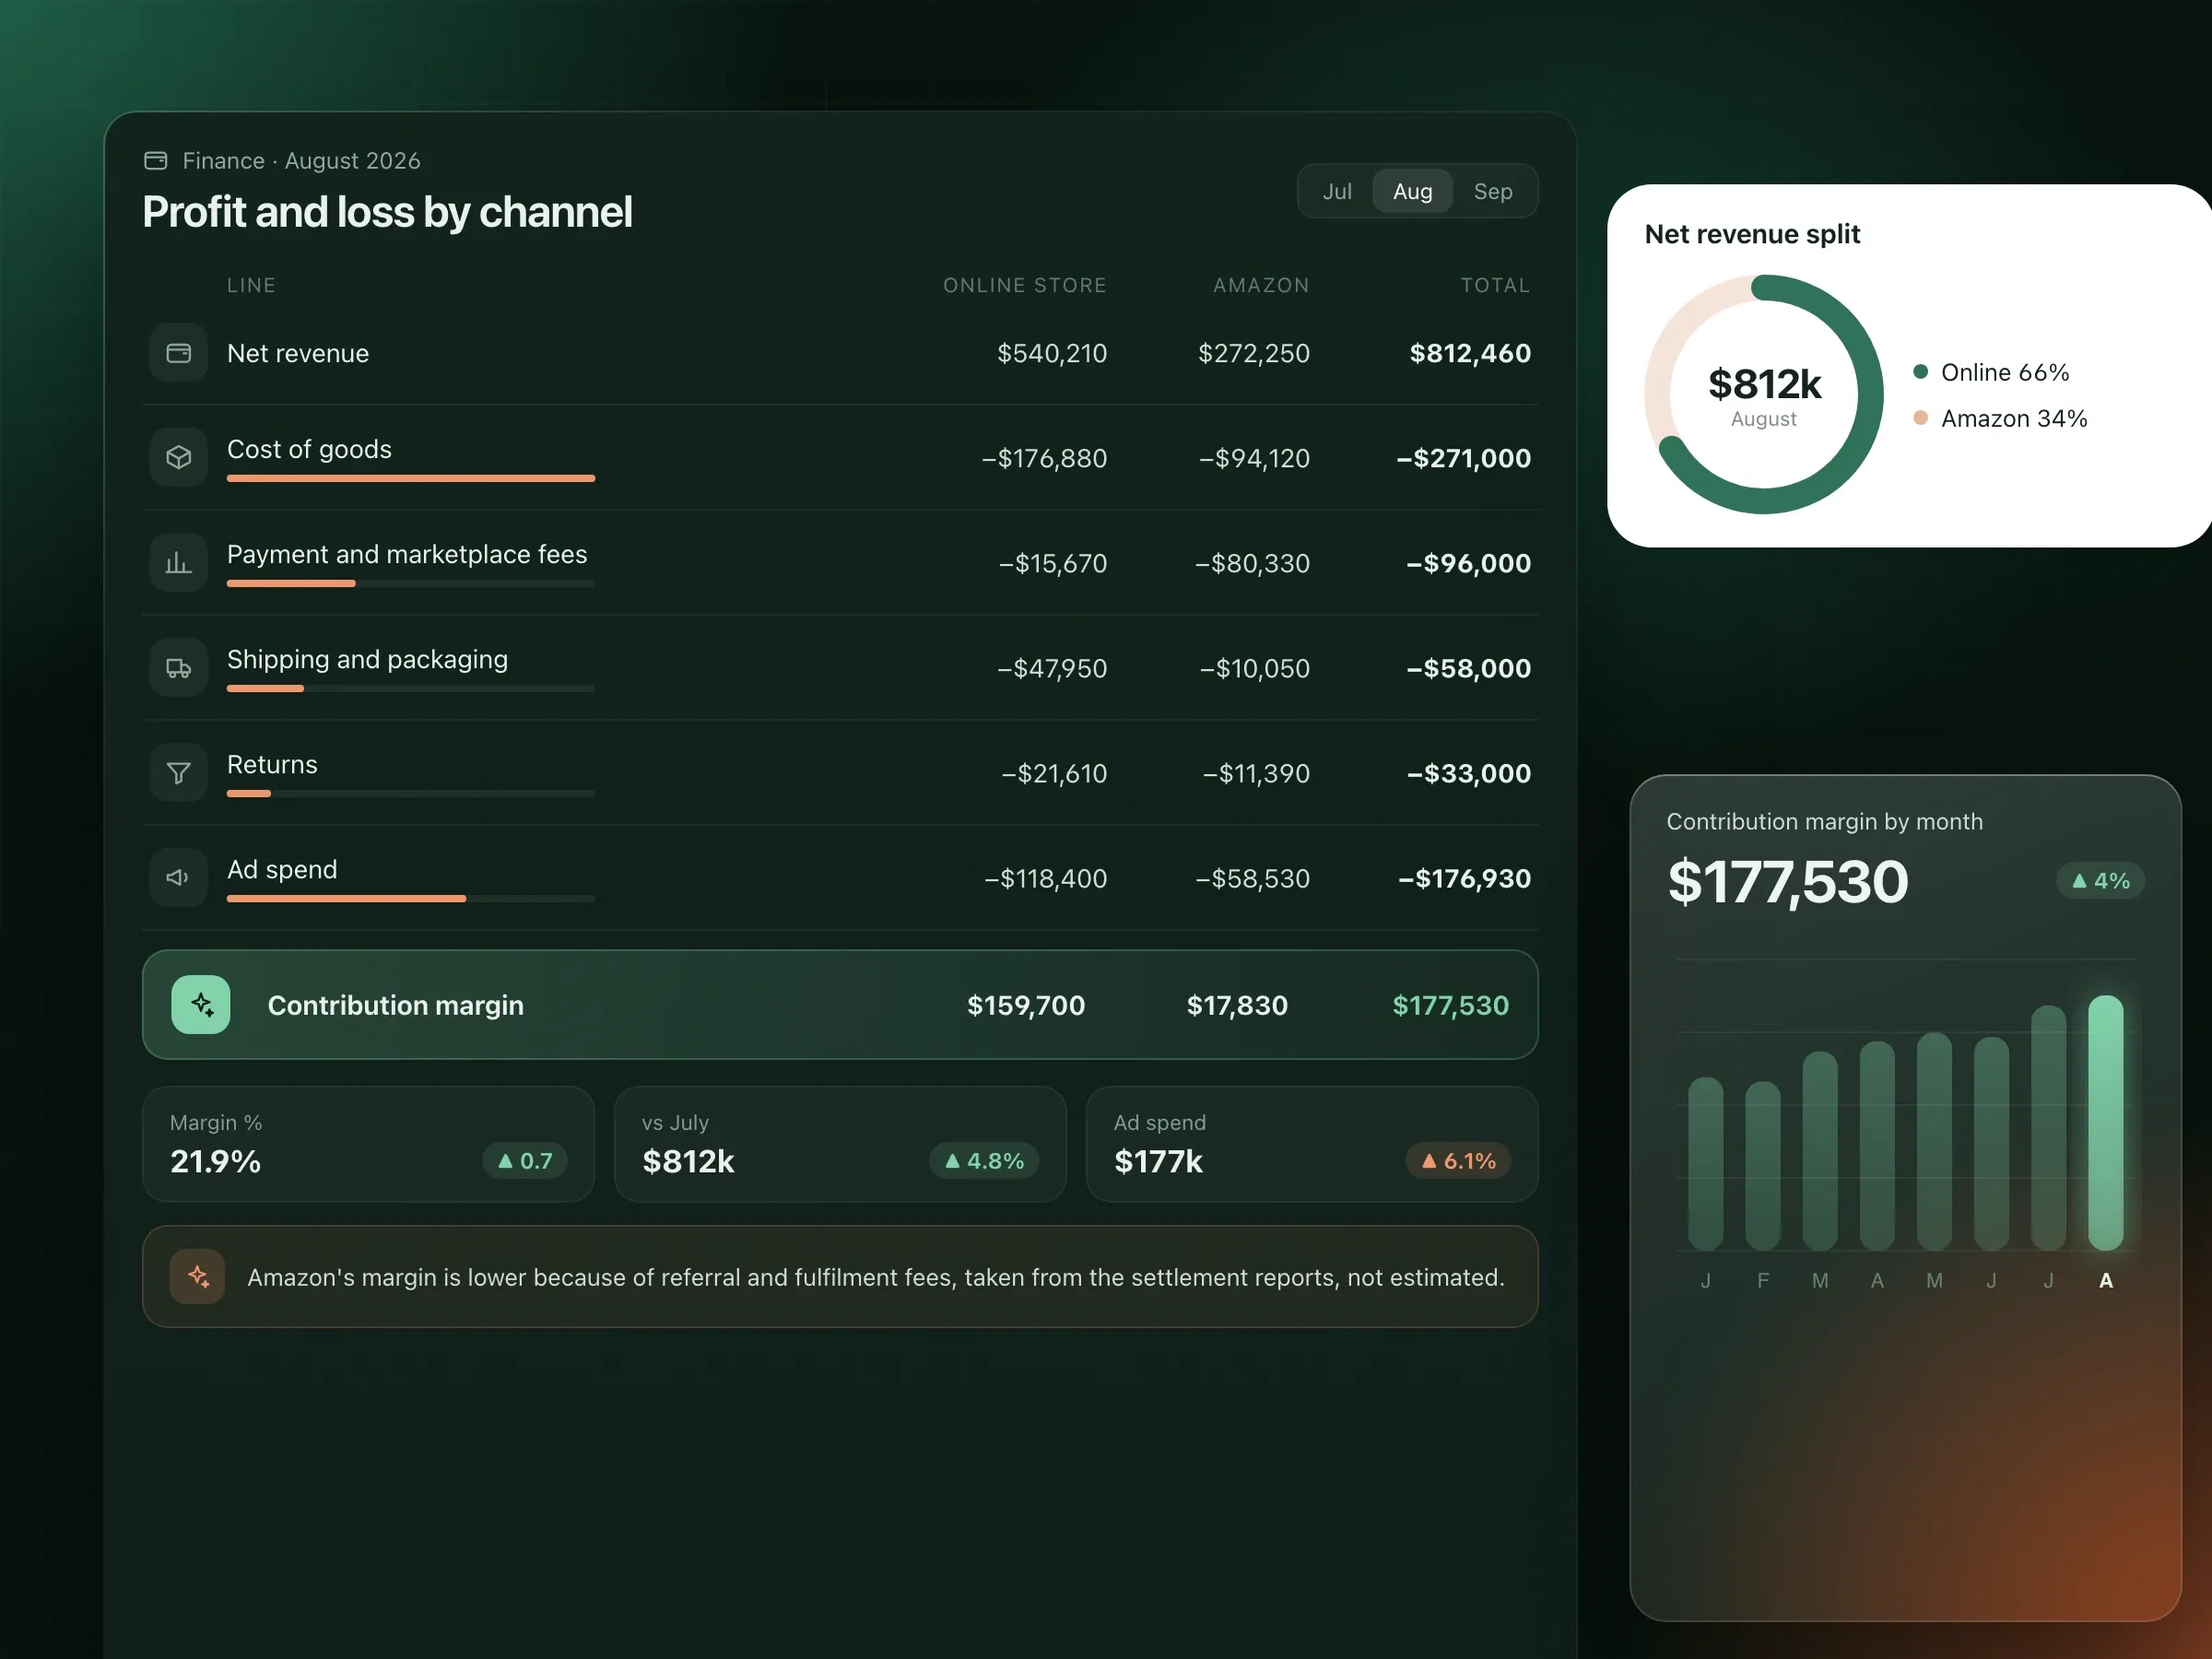
- contribution margin: per order and per product, after cost of goods, payment and marketplace fees, shipping, packaging, returns and ad spend;
- marketing efficiency: total revenue against total ad spend, alongside return on ad spend by channel and campaign;
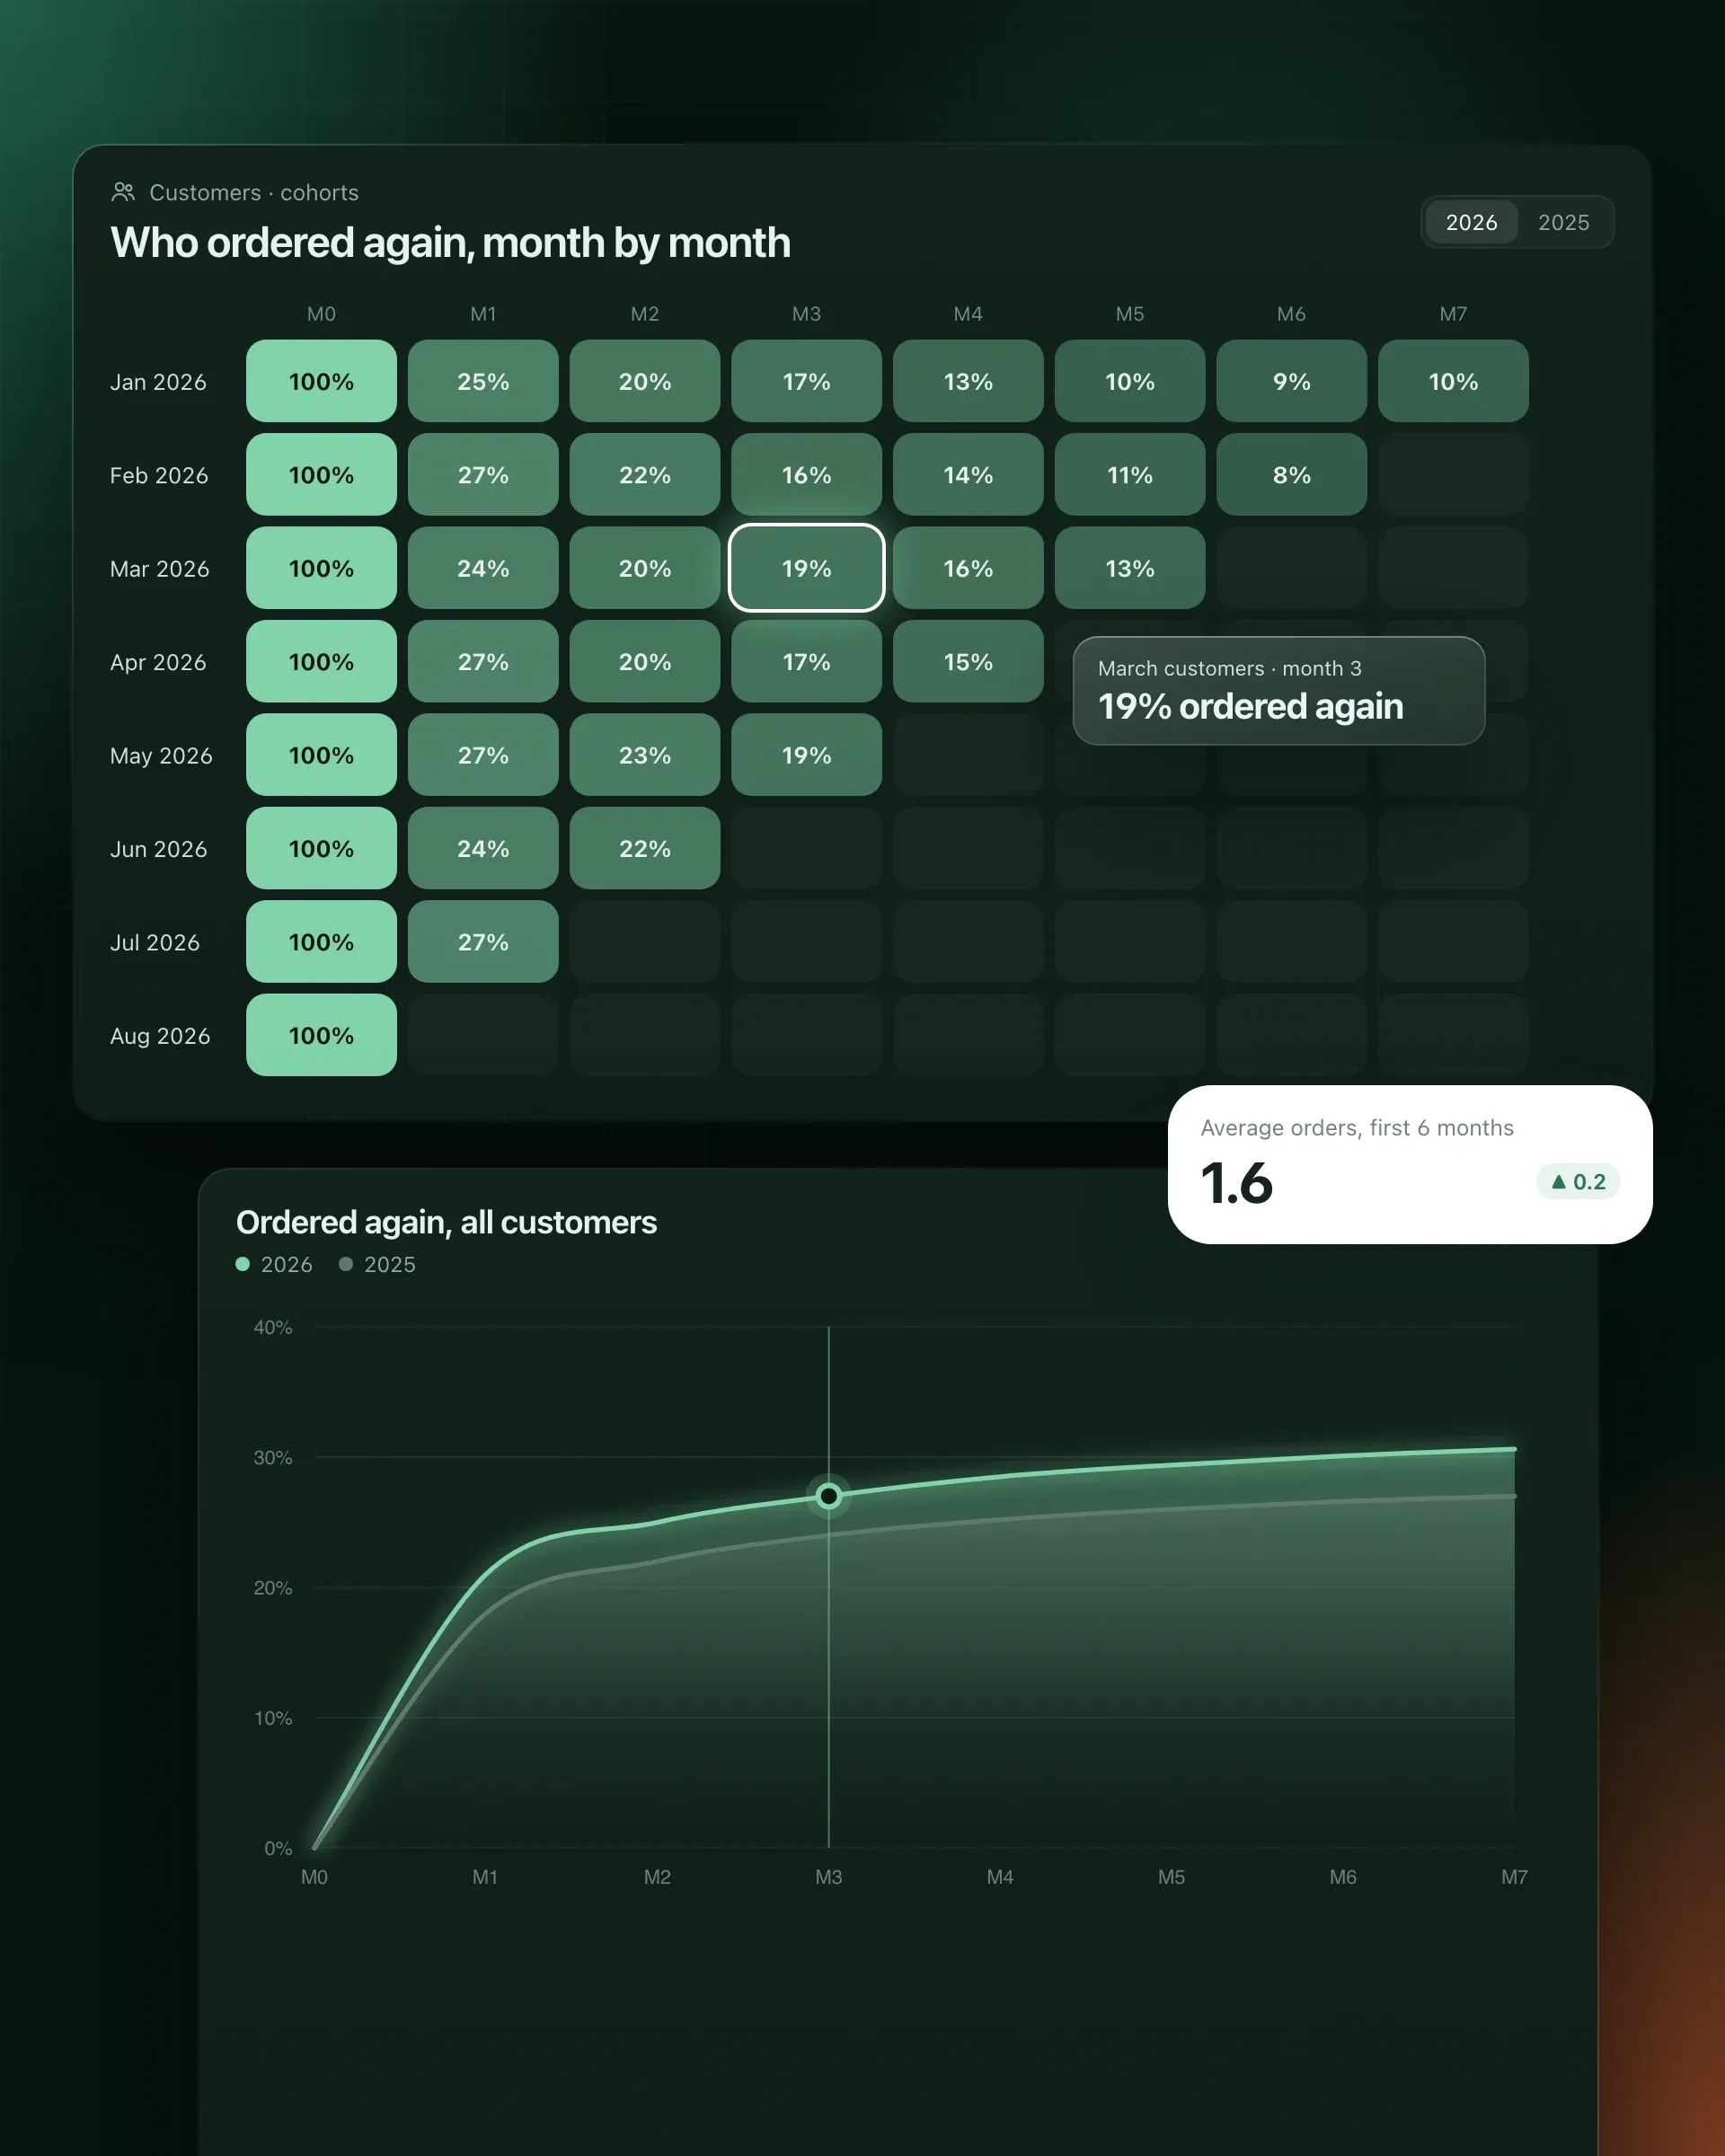
- new versus returning customers, customer acquisition cost and lifetime value by first-purchase month;
- days of stock cover, by product and by channel, including stock held at Amazon.
The data pipeline
The pipeline syncs every source into one BigQuery warehouse automatically: the online store, Amazon, Google Ads, Meta Ads, email, Google Analytics, the warehouse system and the accounting software. Most sources sync daily, and ad platforms sync every few hours during big sales, when spend moves fast. Time zones and currencies are normalised on the way in, so a day means the same thing in every source.
One definition for every number
On top of the raw data, dbt models turn each agreed definition into code, once. Every dashboard, report and AI answer reads from these same models, so the same question always gets the same number.
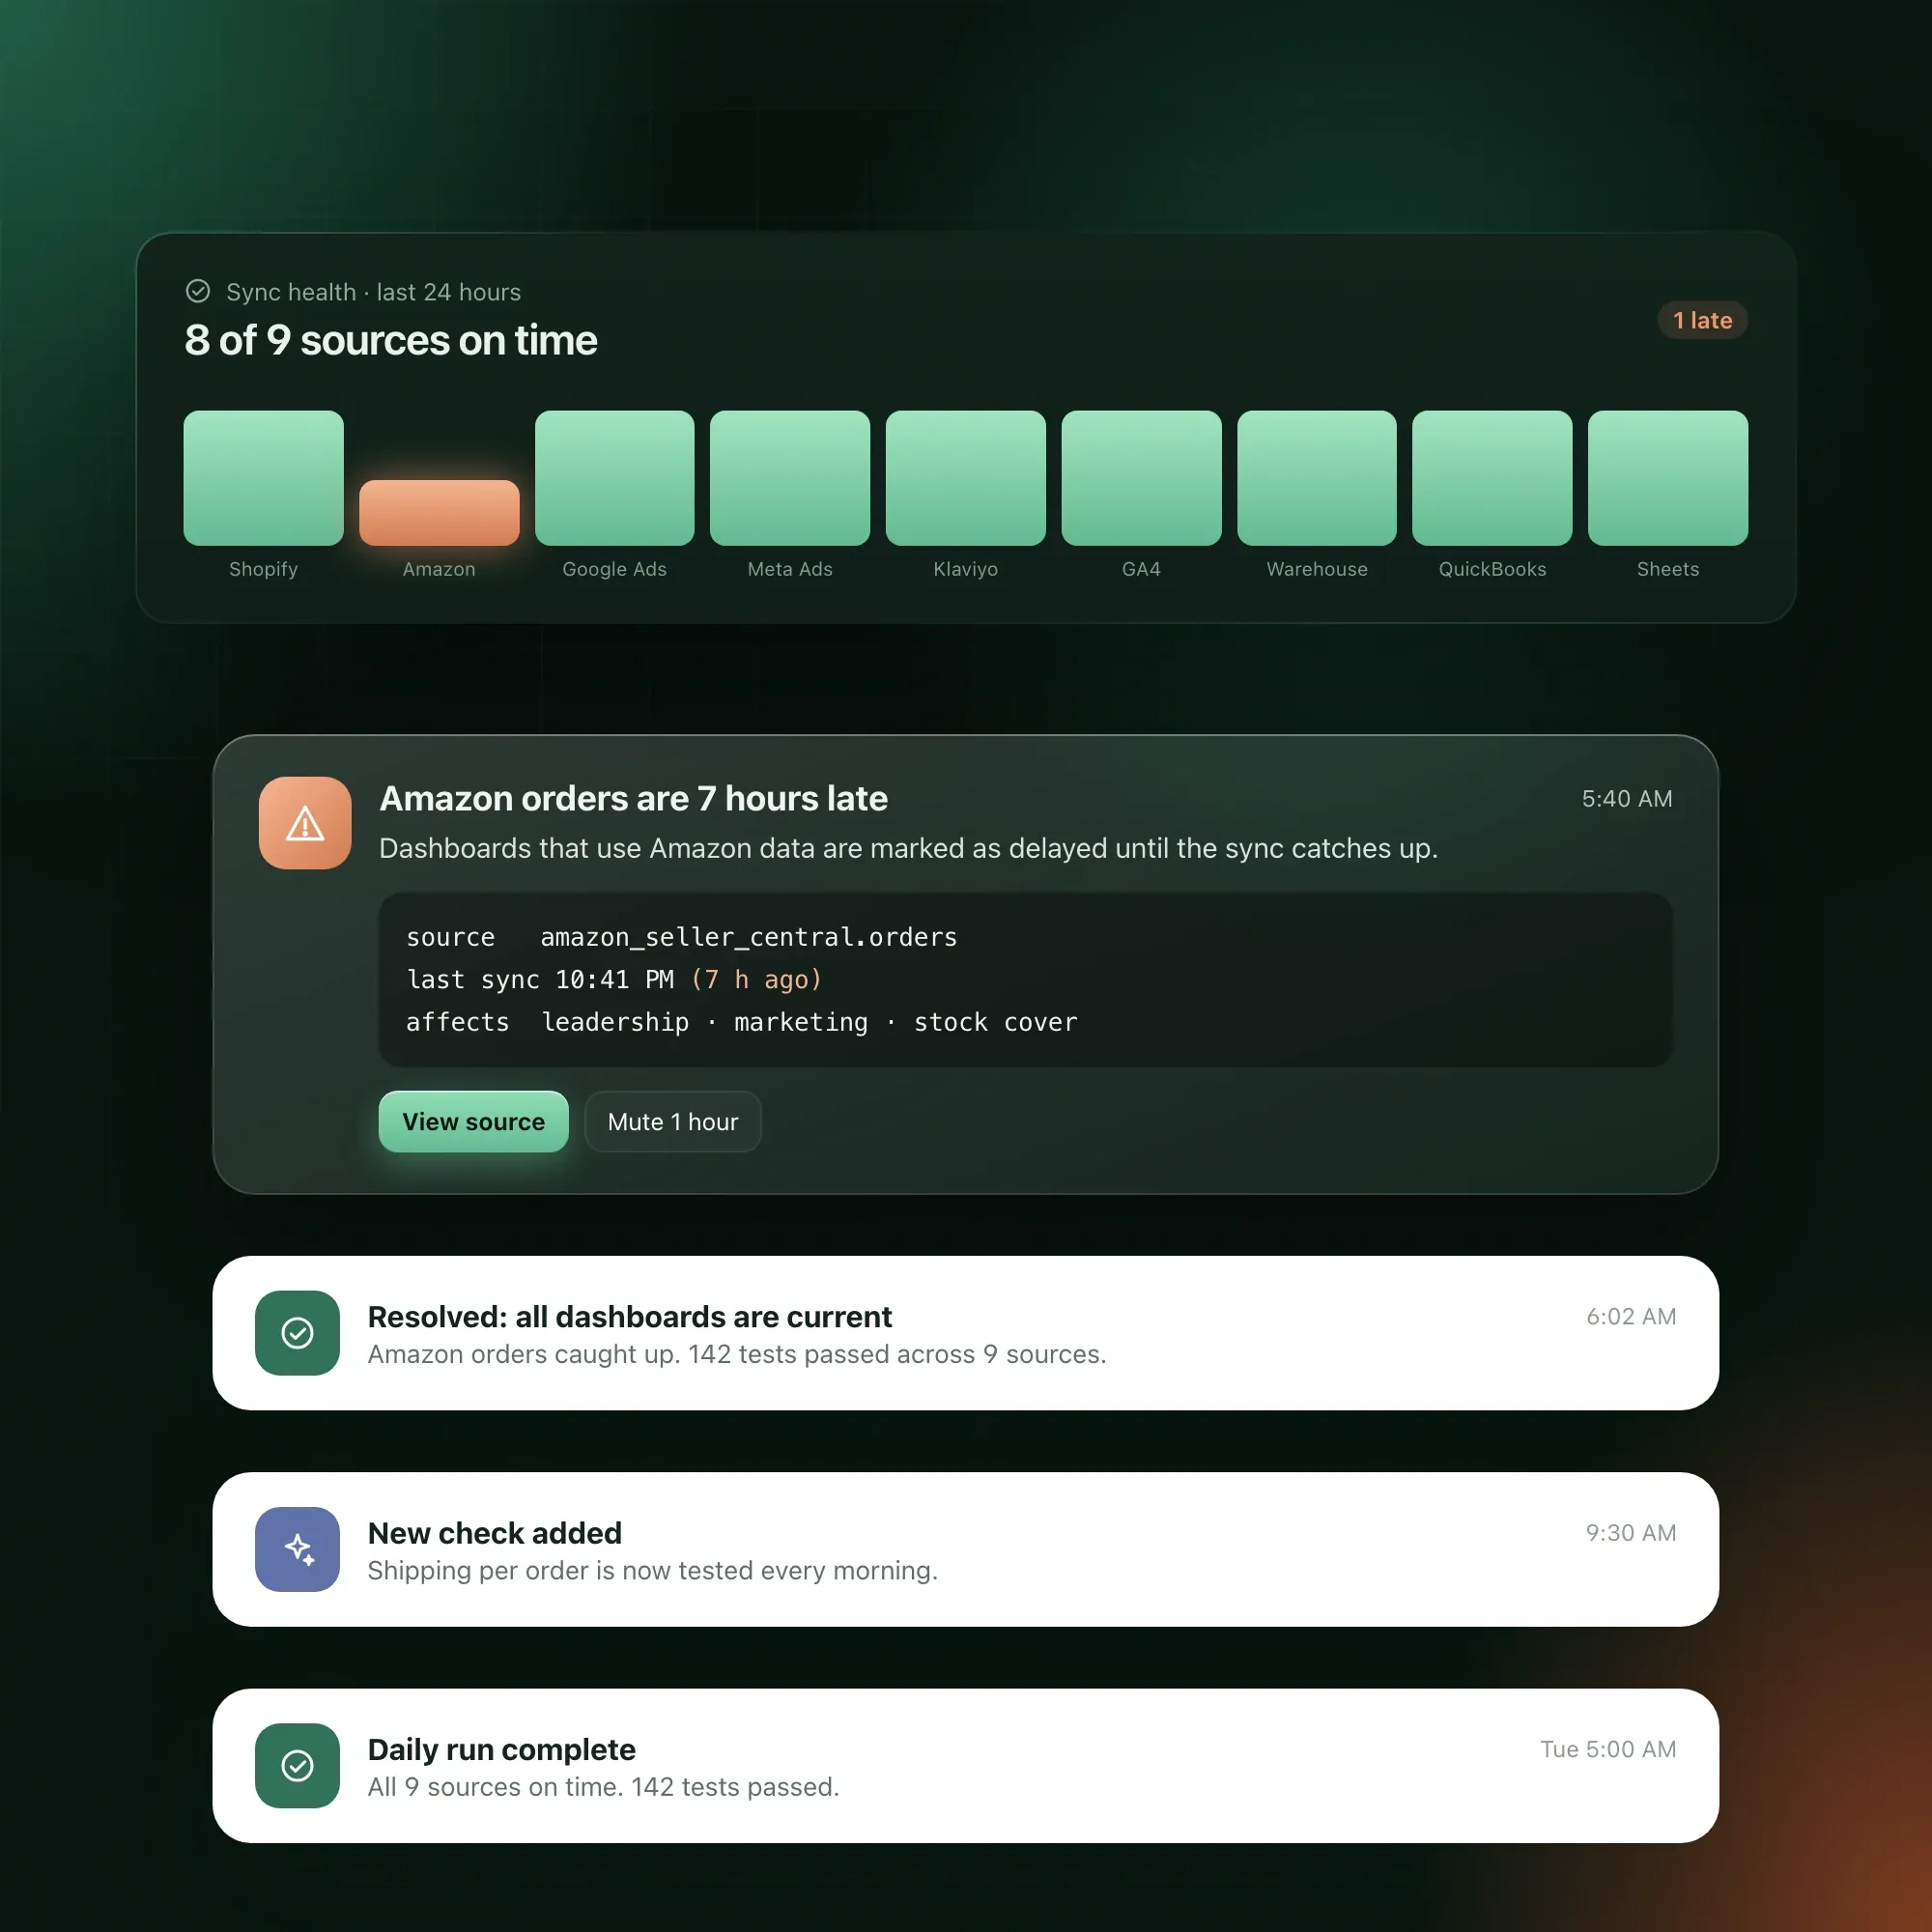
Every model has tests for missing, duplicated or late data. When a source fails to sync or a figure looks wrong, the team is alerted before anyone reads a wrong number.
Dashboards for every team
Each team has dashboards built around its own decisions:
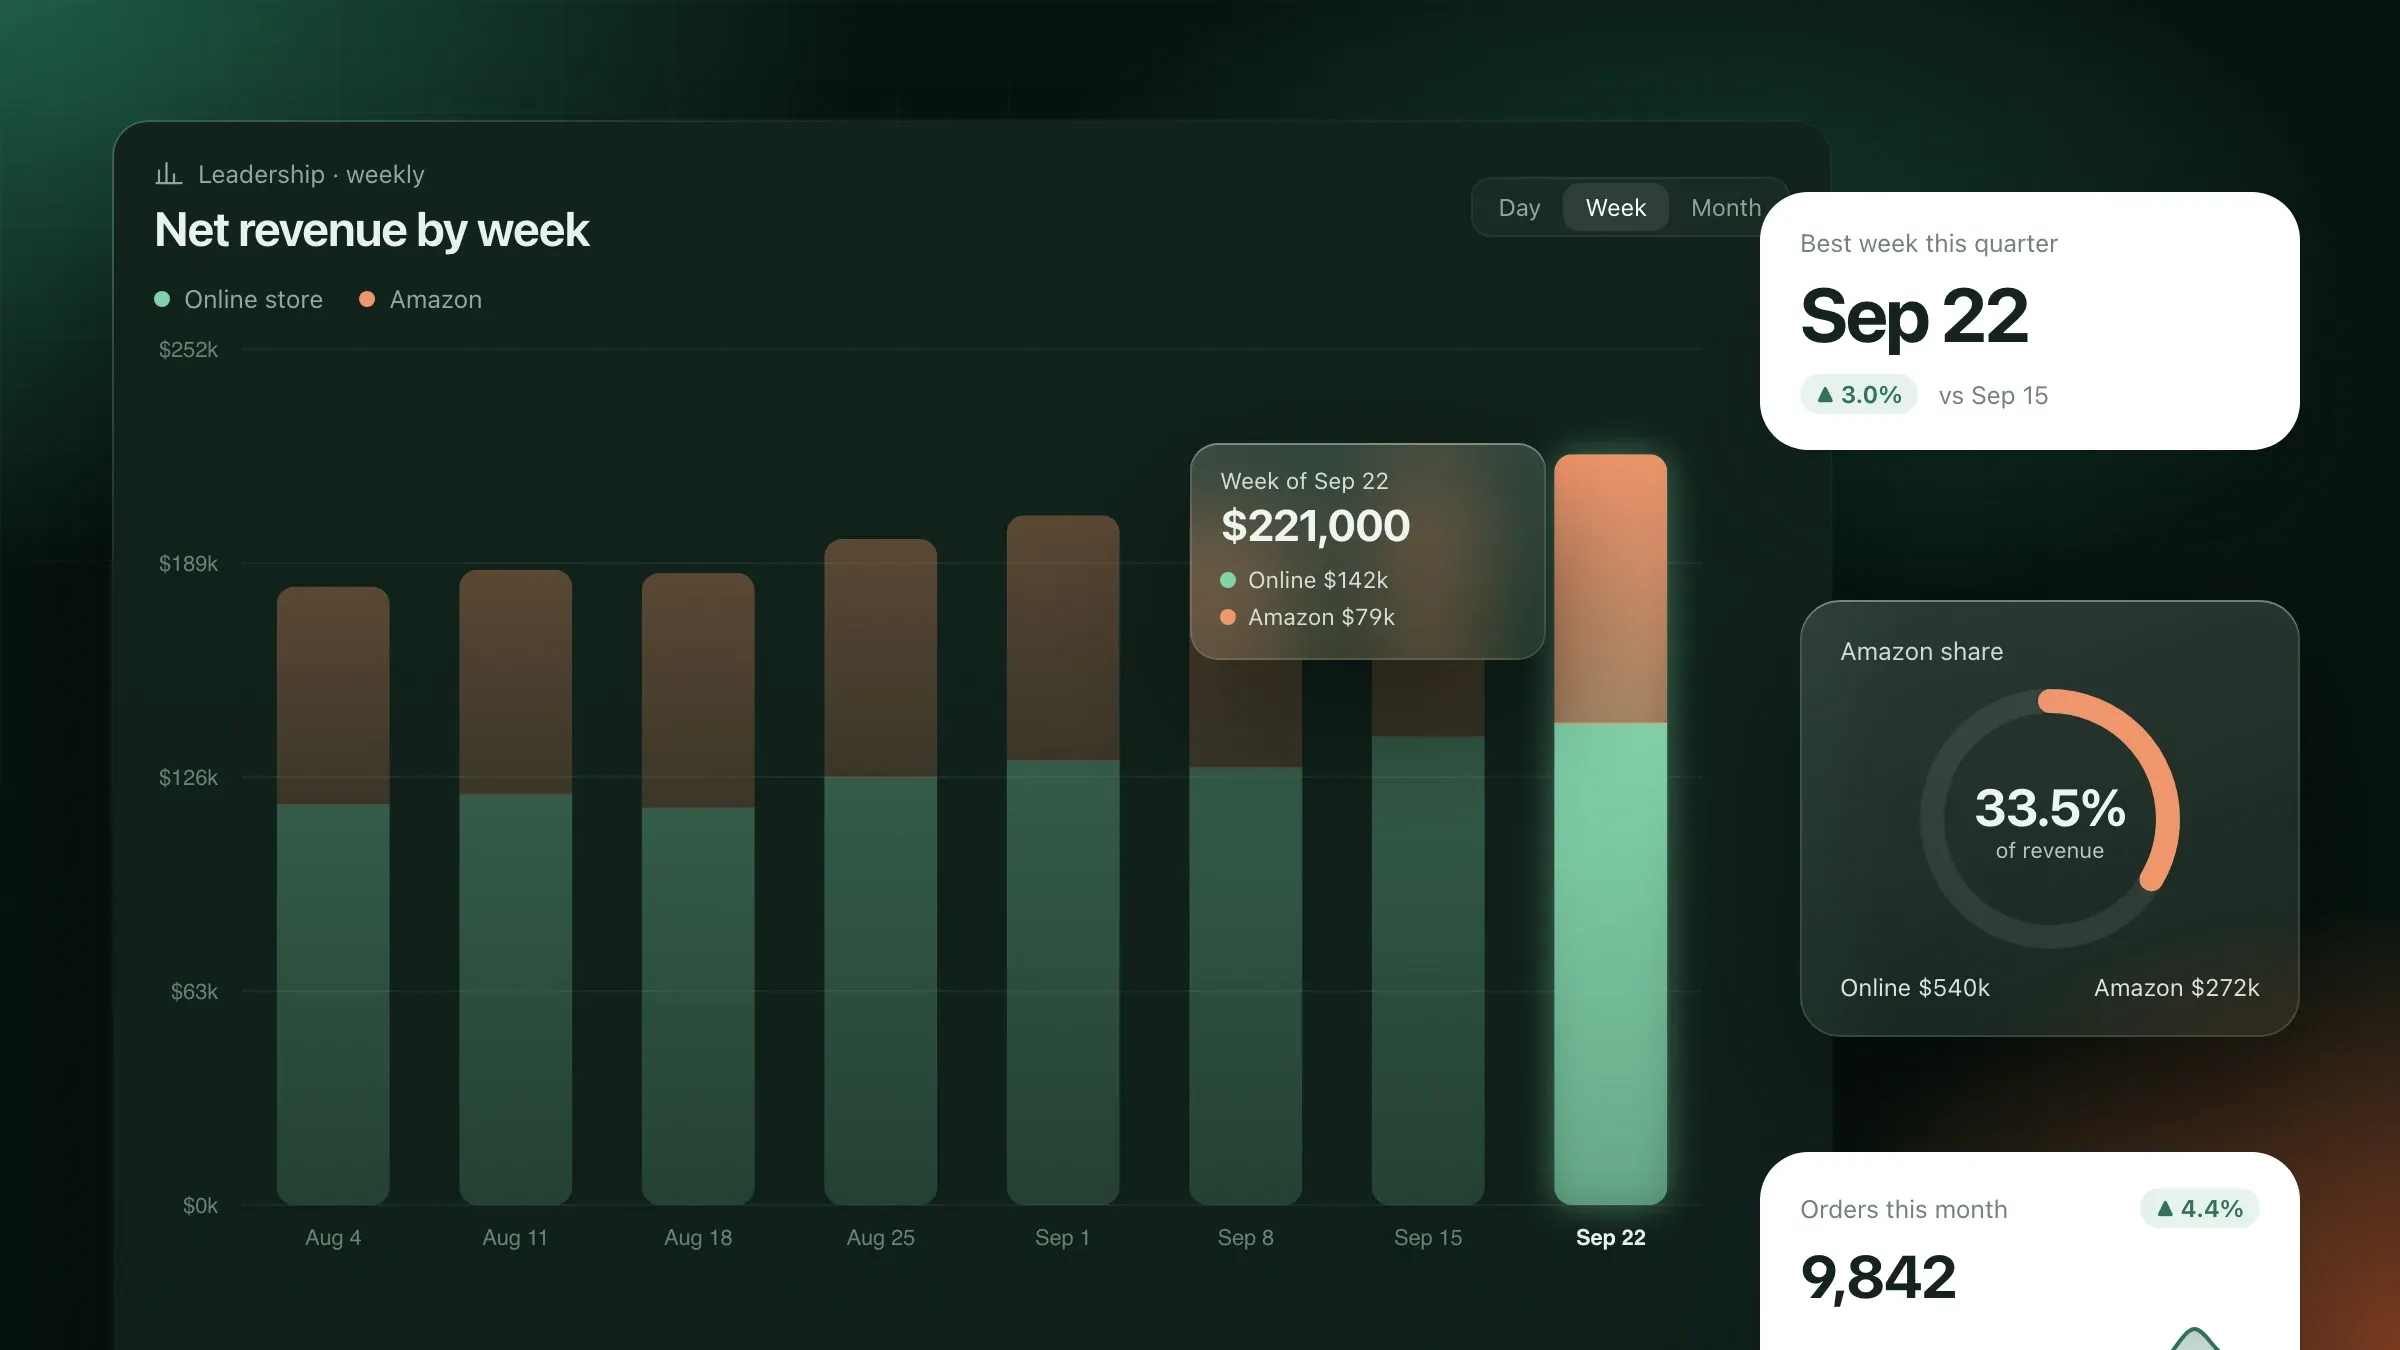
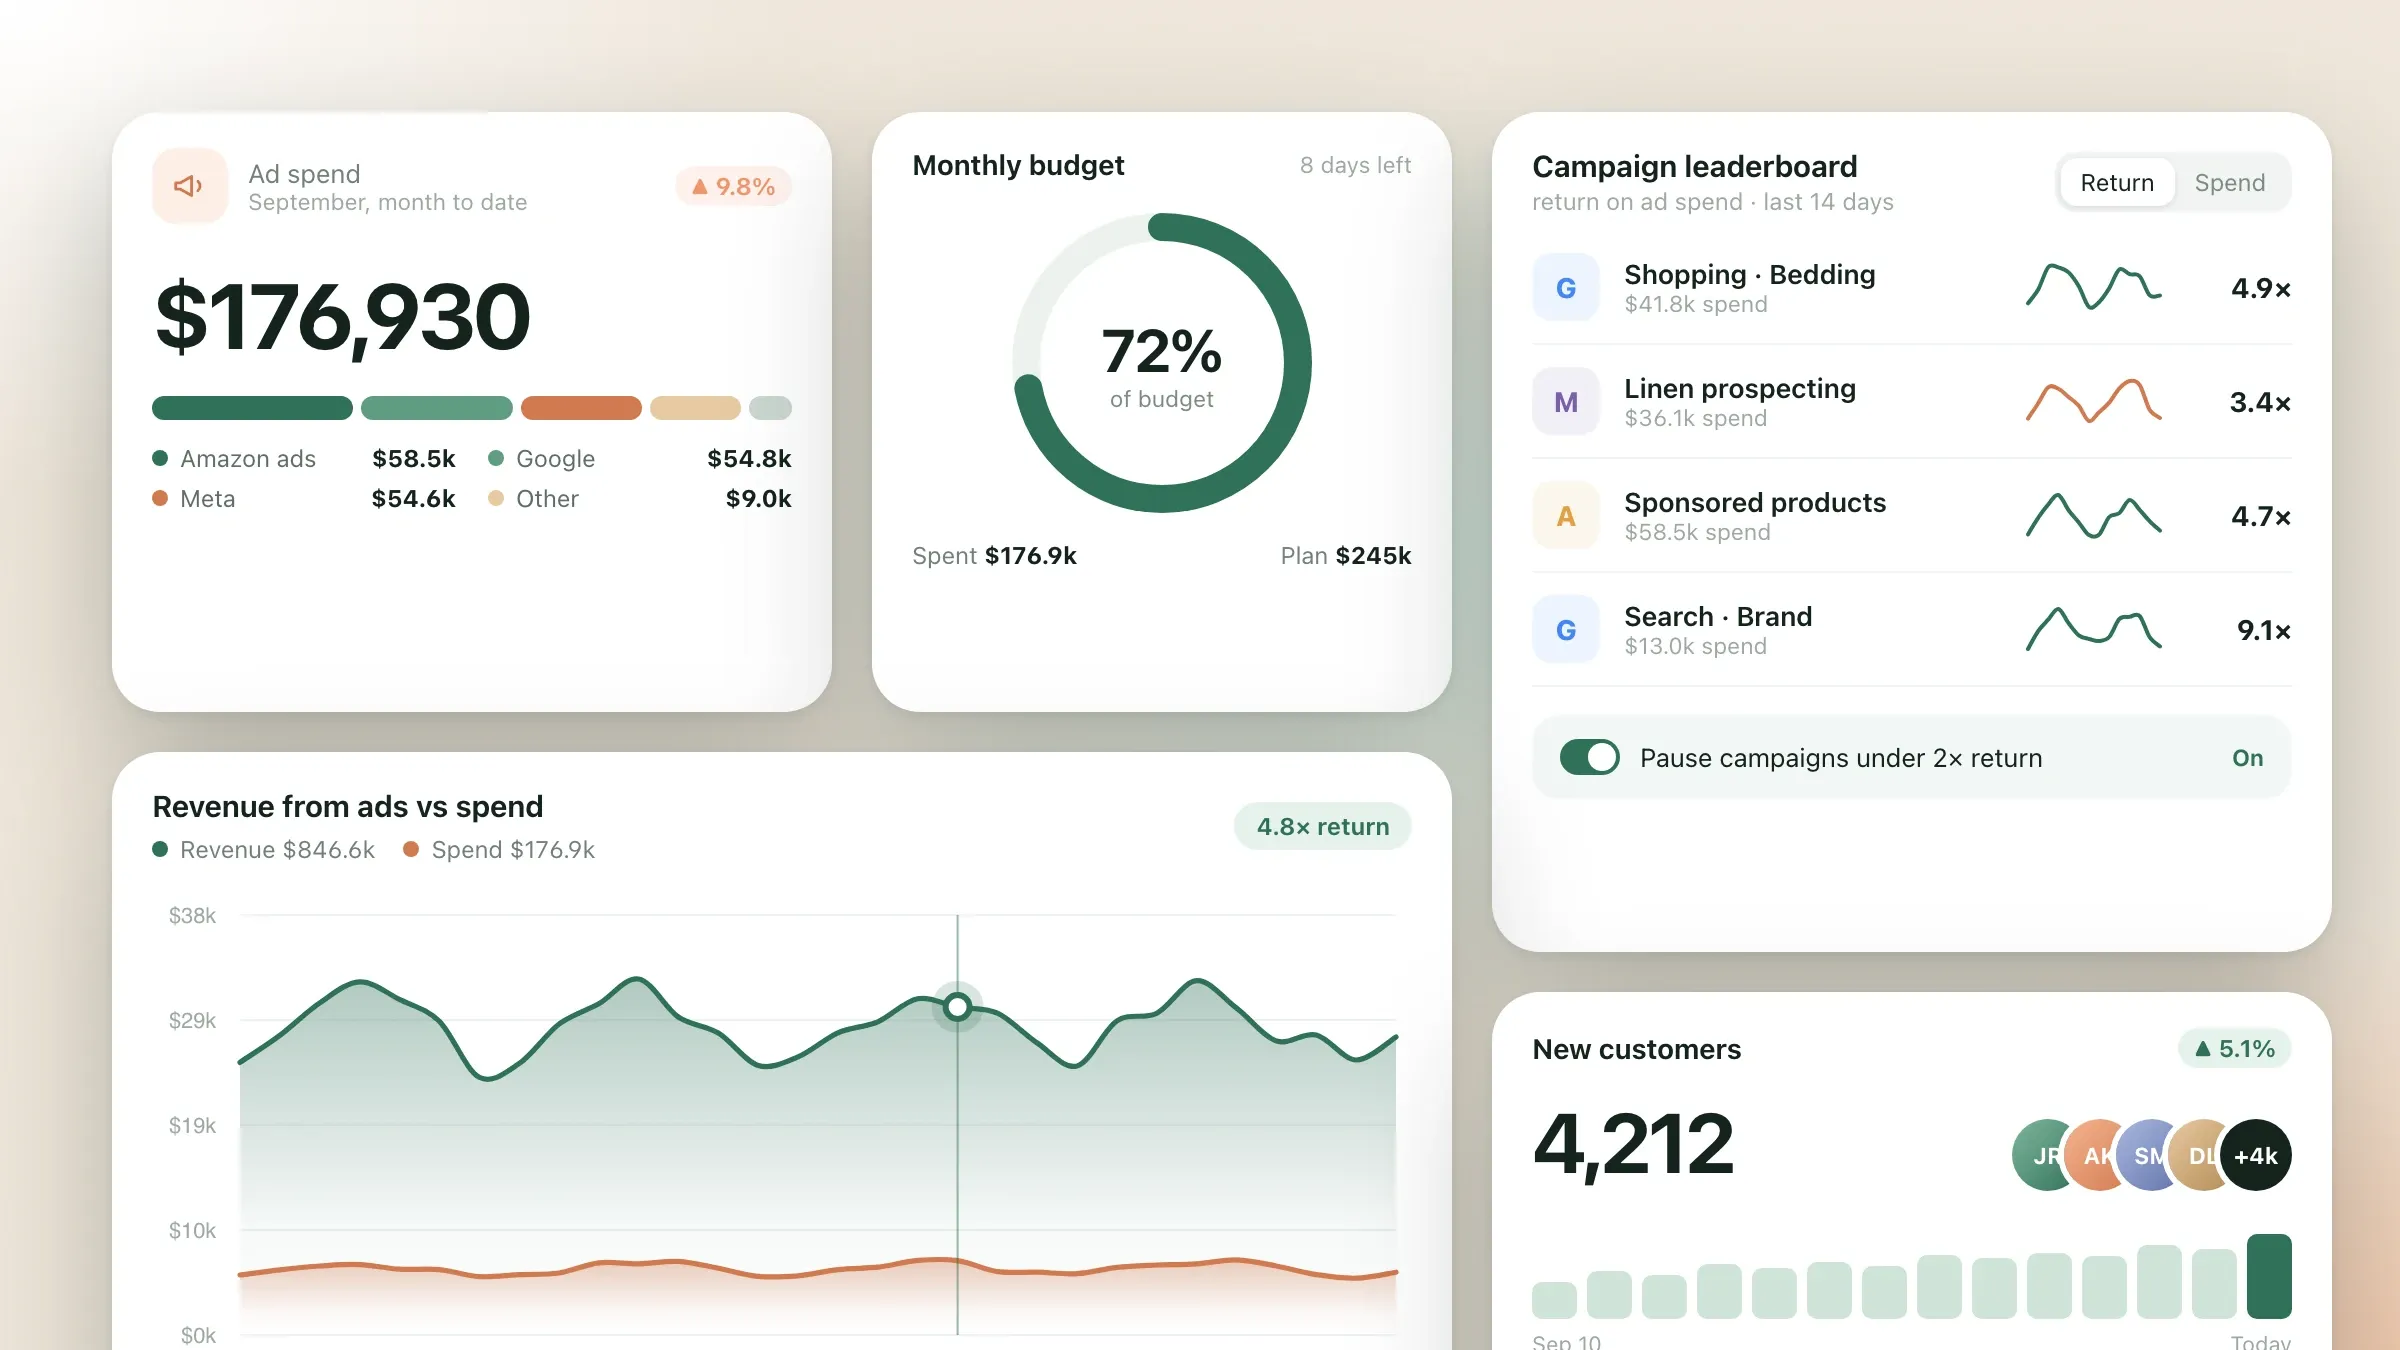
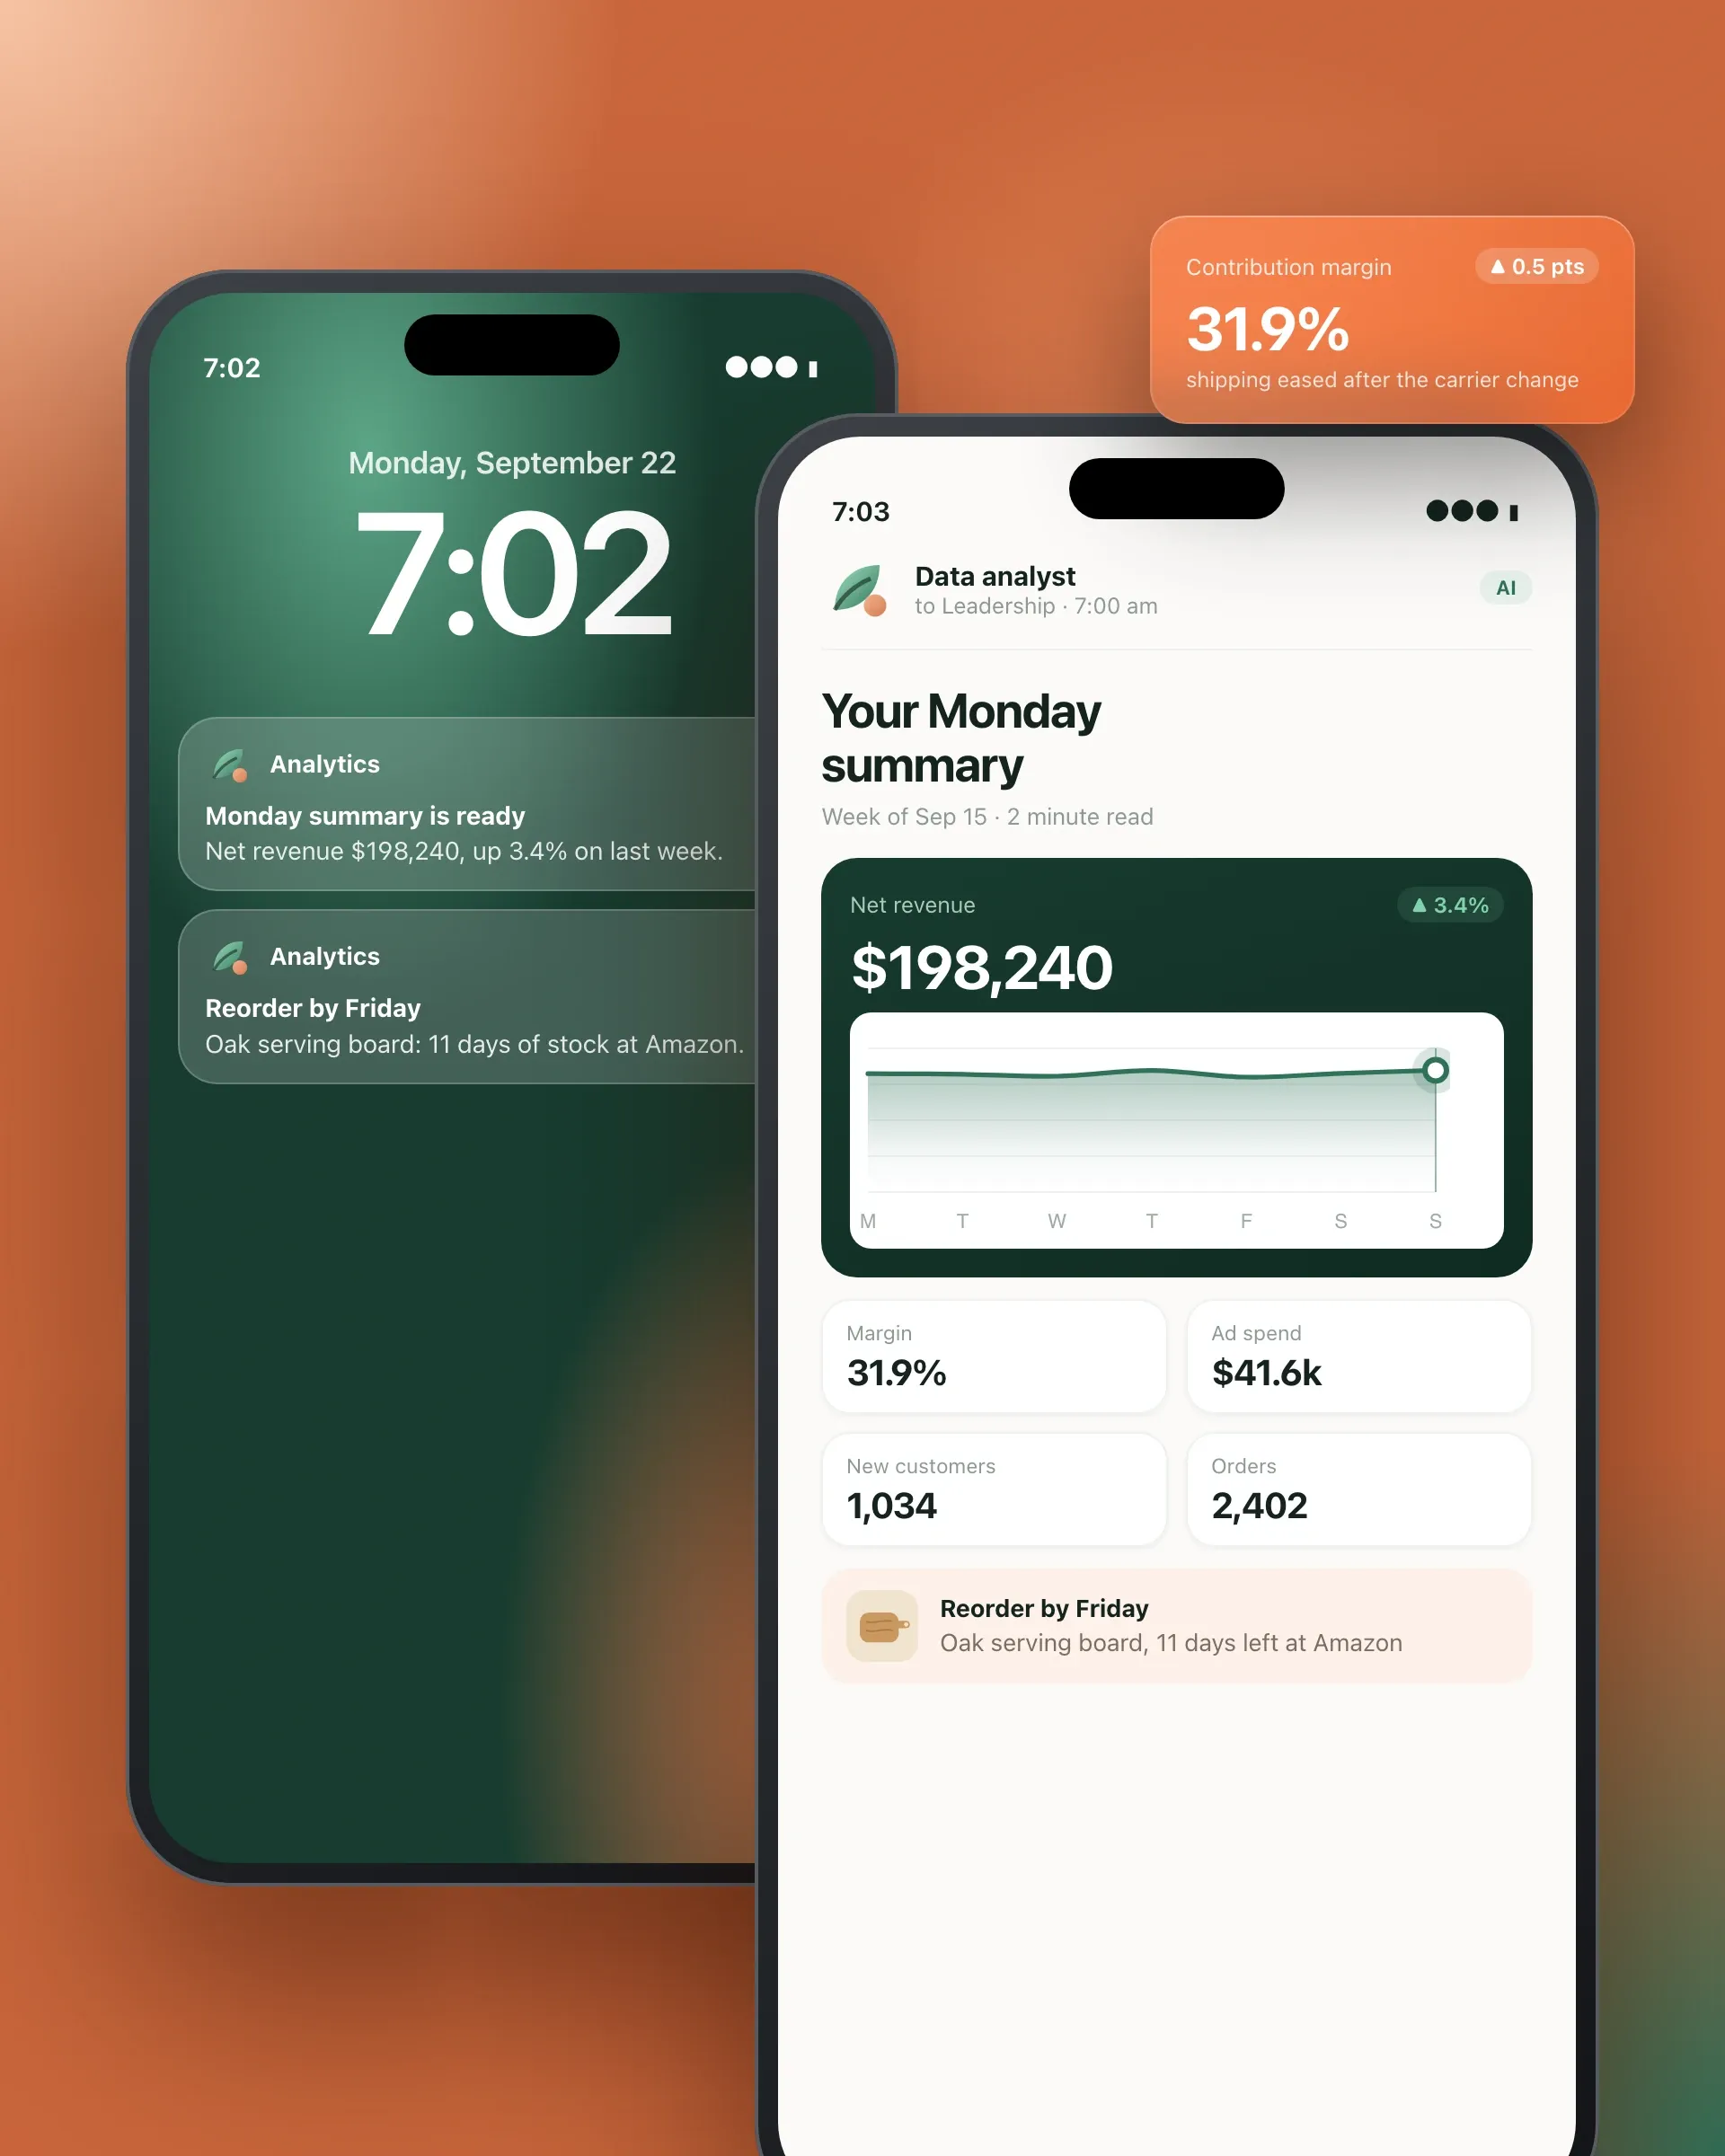
- leadership: a daily snapshot of sales, margin and spend by channel, with the week against the last;
- marketing: spend and return by channel and campaign, new versus returning customers, and acquisition cost;
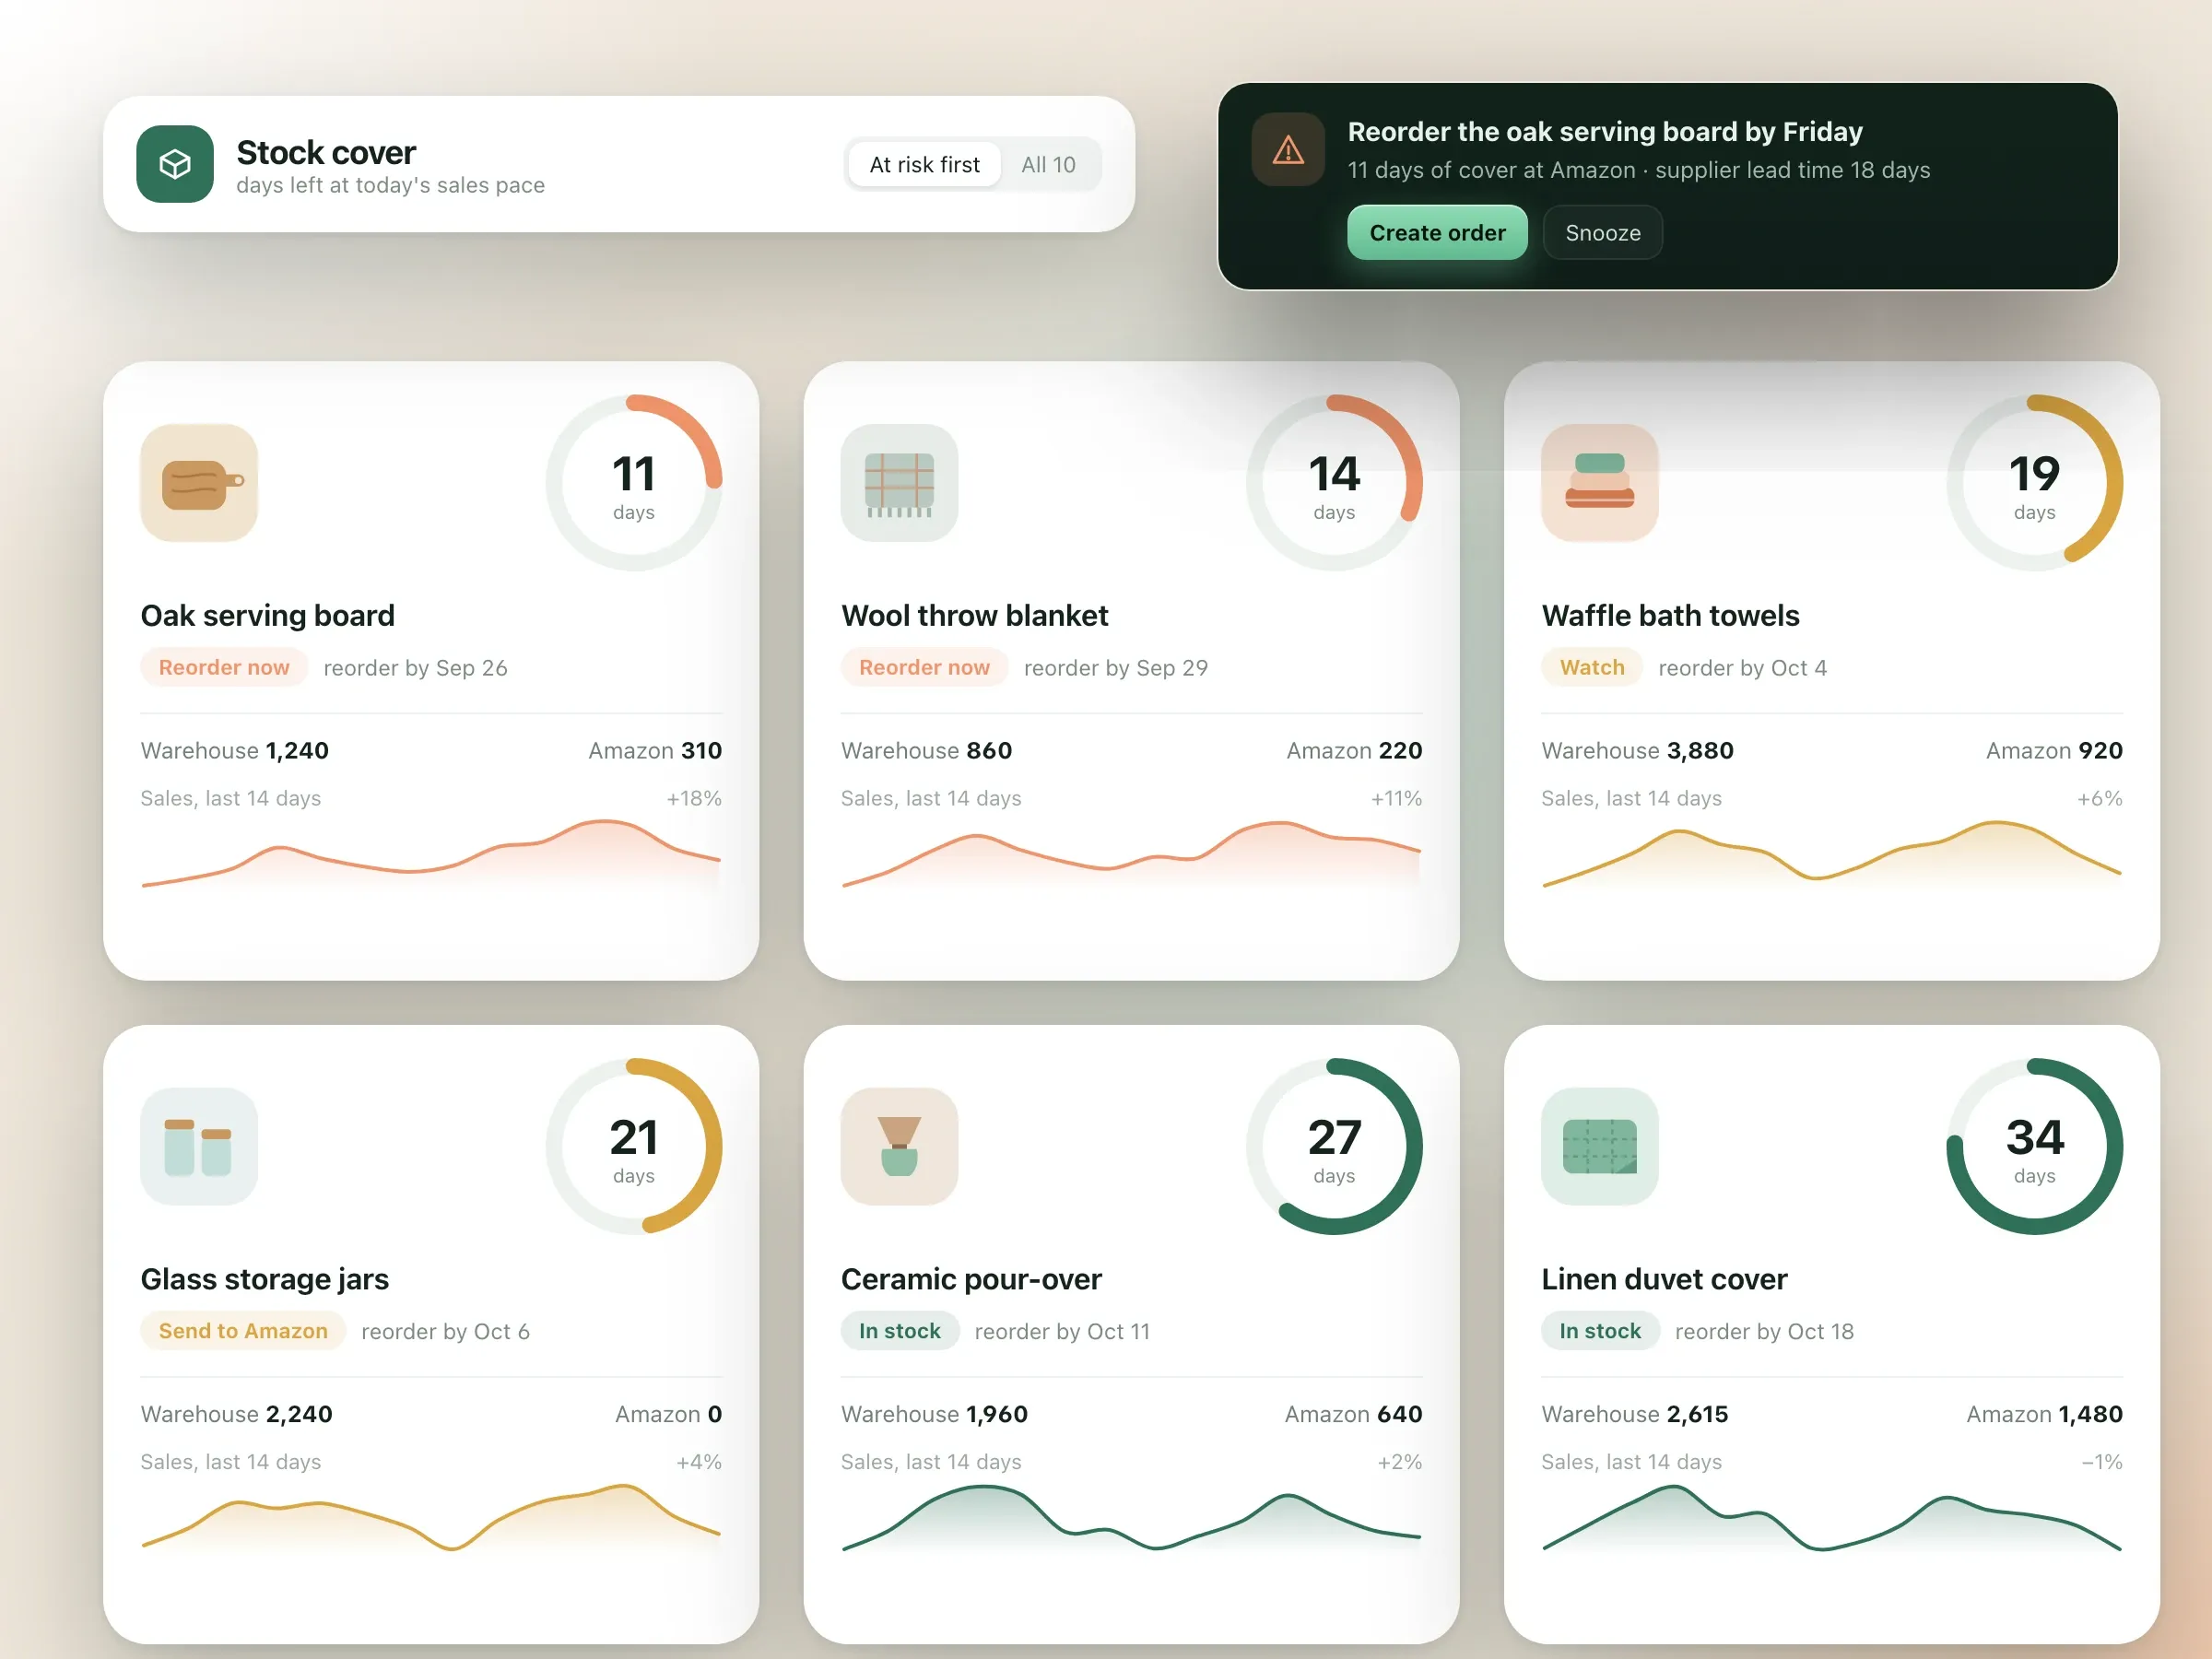
- operations: stock cover, inbound shipments and products at risk of running out;
- finance: profit and loss by channel each month, reconciled to the accounting software.
Before launch, every dashboard was checked against finance’s month-end figures until they matched.
Inventory and reorder alerts
Stock cover is calculated for every product, in the warehouse and at Amazon, from recent sales and each supplier’s lead time. When a product is heading for a stock-out, the operations team is alerted while there is still time to reorder or move stock, not after the listing has gone quiet.
The AI analyst
Anyone in the company can ask a question in plain English, in Slack or in the dashboards: which products lost margin last month and why, or how the spring sale compared with last year’s. The AI analyst answers from the same defined metrics, showing the figure, a chart and the query behind it, so every answer can be checked.
It is built to be trusted. It uses only the defined metrics, it follows the same access rules as the dashboards, and when the data to answer a question doesn’t exist, it says so instead of guessing. Every Monday morning, it also writes a short summary of the week for the leadership team: what moved, what to watch, and links to the details.
How it’s built
Airbyte syncs every source into BigQuery, dbt builds and tests the models, and Metabase serves the dashboards. The AI analyst runs on Claude, querying only the defined metrics through a controlled set of tools, and answers in Slack and the dashboards. Everything runs on Google Cloud, with access for each team set by role. At handover, the team was trained to add metrics and dashboards themselves.
The outcome
The Monday spreadsheet has been retired, and every team now works from the same numbers. Margins are visible per product after every cost, stock warnings arrive before stock runs out, and leadership asks its own questions and gets answers straight away, with the working shown.
How the project ran
3 months in 6 phases
- Weeks 1–2
Metrics first
Interviews with leadership, marketing, operations and finance, and one agreed definition for every number the business runs on.
- Weeks 3–5
Data pipeline
Daily syncs from the store, Amazon, ad platforms, email, the warehouse and accounting into one warehouse.
- Weeks 5–7
Models and tests
Data models for revenue, margin, ad return, customers and stock, with tests that catch late or broken data.
- Weeks 8–10
Dashboards
Dashboards for leadership, marketing, operations and finance, checked against finance's month-end figures.
- Weeks 11–13
AI analyst and handover
Plain-English questions in Slack and the dashboards, the Monday summary, access rules and training for the team.
- Week 14 onwards
Support
New sources and metrics as the brand grows, and the AI analyst tuned from the questions people ask.
What we delivered
- Data strategy
- Data engineering
- Dashboards
- AI agents and automation
- Cloud
- Maintenance and support
Inside the project
7 pictures
Questions and answers
10 answered
What did FIRELIFE Ventures build for an e-commerce brand in Denver?
FIRELIFE Ventures built a business intelligence platform for a home goods e-commerce brand in Denver. It brings store, Amazon, ads, email, warehouse and accounting data into one warehouse, defines every number once, and adds dashboards for each team and an AI analyst that answers questions in plain English.
What are business intelligence dashboards?
Business intelligence dashboards bring data from every tool a business uses into live charts and tables, so teams see sales, costs, stock and performance in one place instead of building spreadsheets by hand.
What is a single source of truth for business data?
A single source of truth means every number, such as net revenue or contribution margin, is defined once and calculated the same way everywhere. Every dashboard and report then agrees, and meetings stop arguing about whose figure is right.
What is contribution margin per product?
Contribution margin per product is what each product earns after its direct costs: cost of goods, payment and marketplace fees, shipping and packaging, returns, and its share of ad spend. It shows which products actually make money, not just which sell the most.
How does AI answer questions about business data?
The AI turns a question in plain English into a query on the brand's own defined metrics, then answers with the figure, a chart and the query it used. Because it uses the same definitions as the dashboards, the numbers match, and if the data to answer doesn't exist, it says so.
Can the AI see data a person isn't allowed to see?
No. The AI analyst follows the same access rules as the dashboards, so someone who can't see finance data can't get it by asking the AI.
Which data sources can be connected?
Most business tools can be connected, including online stores, marketplaces such as Amazon, ad platforms, email tools, warehouse and inventory systems, accounting software and spreadsheets. Each source syncs automatically, daily or more often.
How do you know the numbers are right?
Every data model has tests for missing, duplicated or late data, and the team is alerted when a test fails. The dashboards were checked against finance's month-end figures before anyone relied on them.
How long does it take to build business intelligence dashboards?
The project took three months, from agreeing metric definitions to the AI analyst and team training. Fewer data sources can take less time.
Can FIRELIFE Ventures build BI dashboards for my business?
Yes. FIRELIFE Ventures builds data pipelines, business intelligence dashboards and AI analysts for growing businesses, and supports them after launch. Start a project through the contact page.
More from the portfolio
All portfolio-
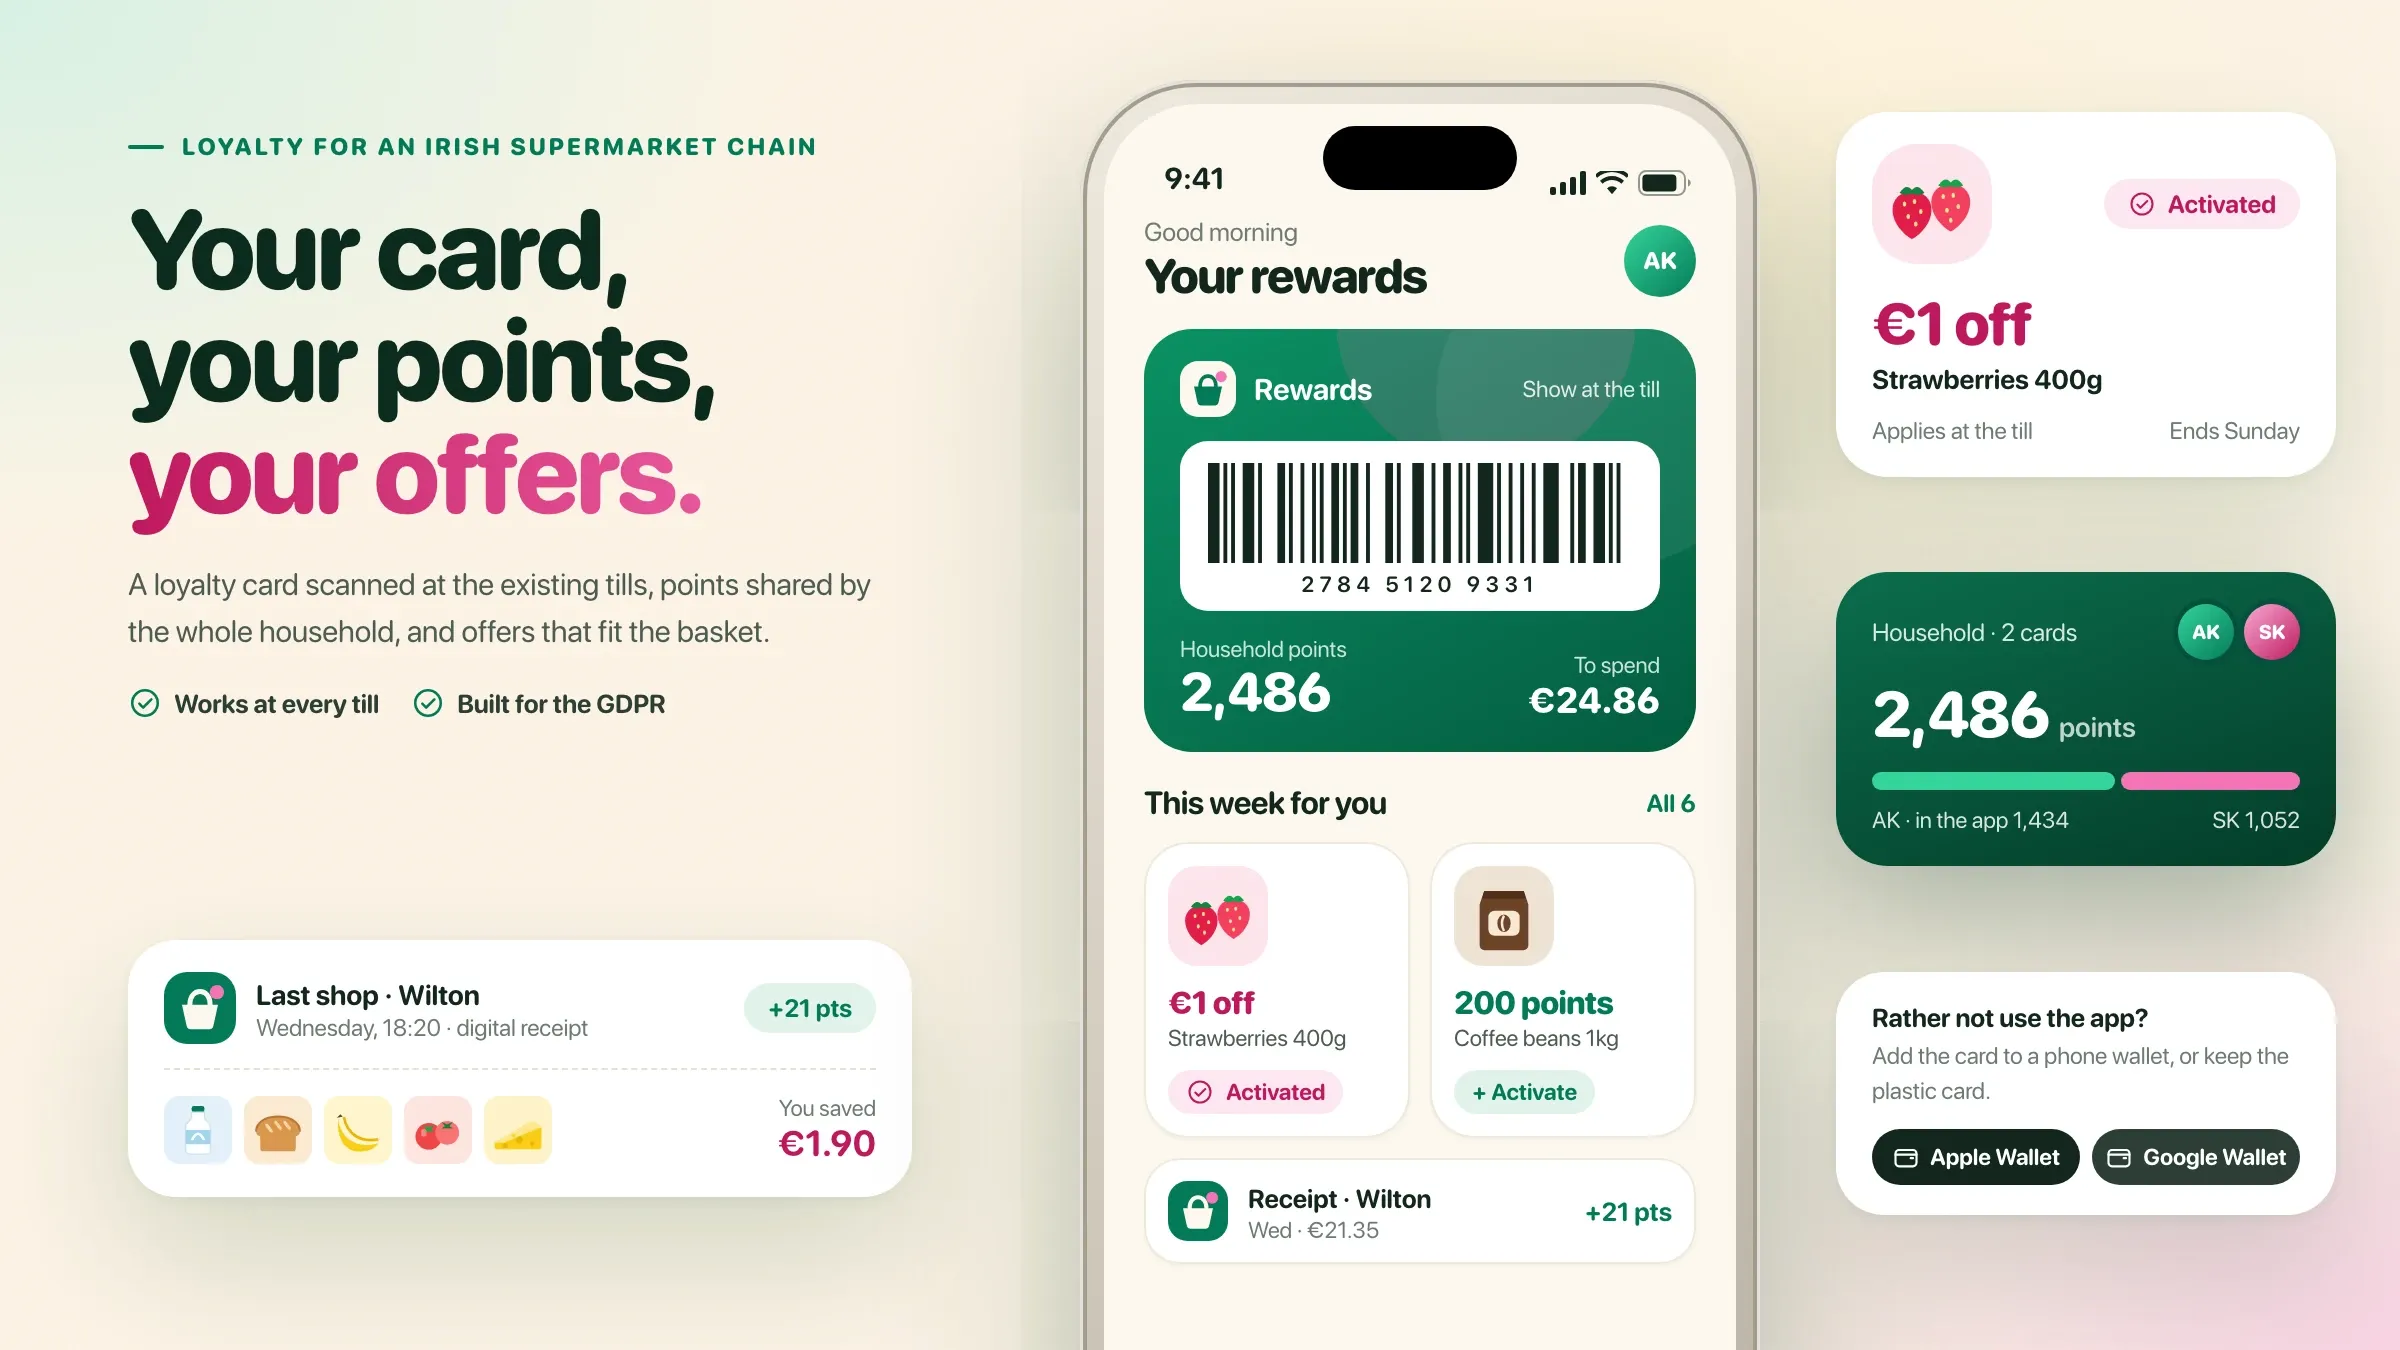 Supermarket Loyalty App A loyalty and rewards app for a supermarket chain in Ireland: a digital loyalty card scanned at the existing tills, household points, personalised offers, supplier-funded deals and digital receipts, built for the GDPR.
-
 Farm-to-Buyer Trading App A farm-to-buyer agritech app for a farmer producer company in Nashik: produce listed by voice in Marathi, AI grading from photos confirmed at the collection centre, open bids with the mandi rate in view, and payments straight to farmers' bank accounts.
-
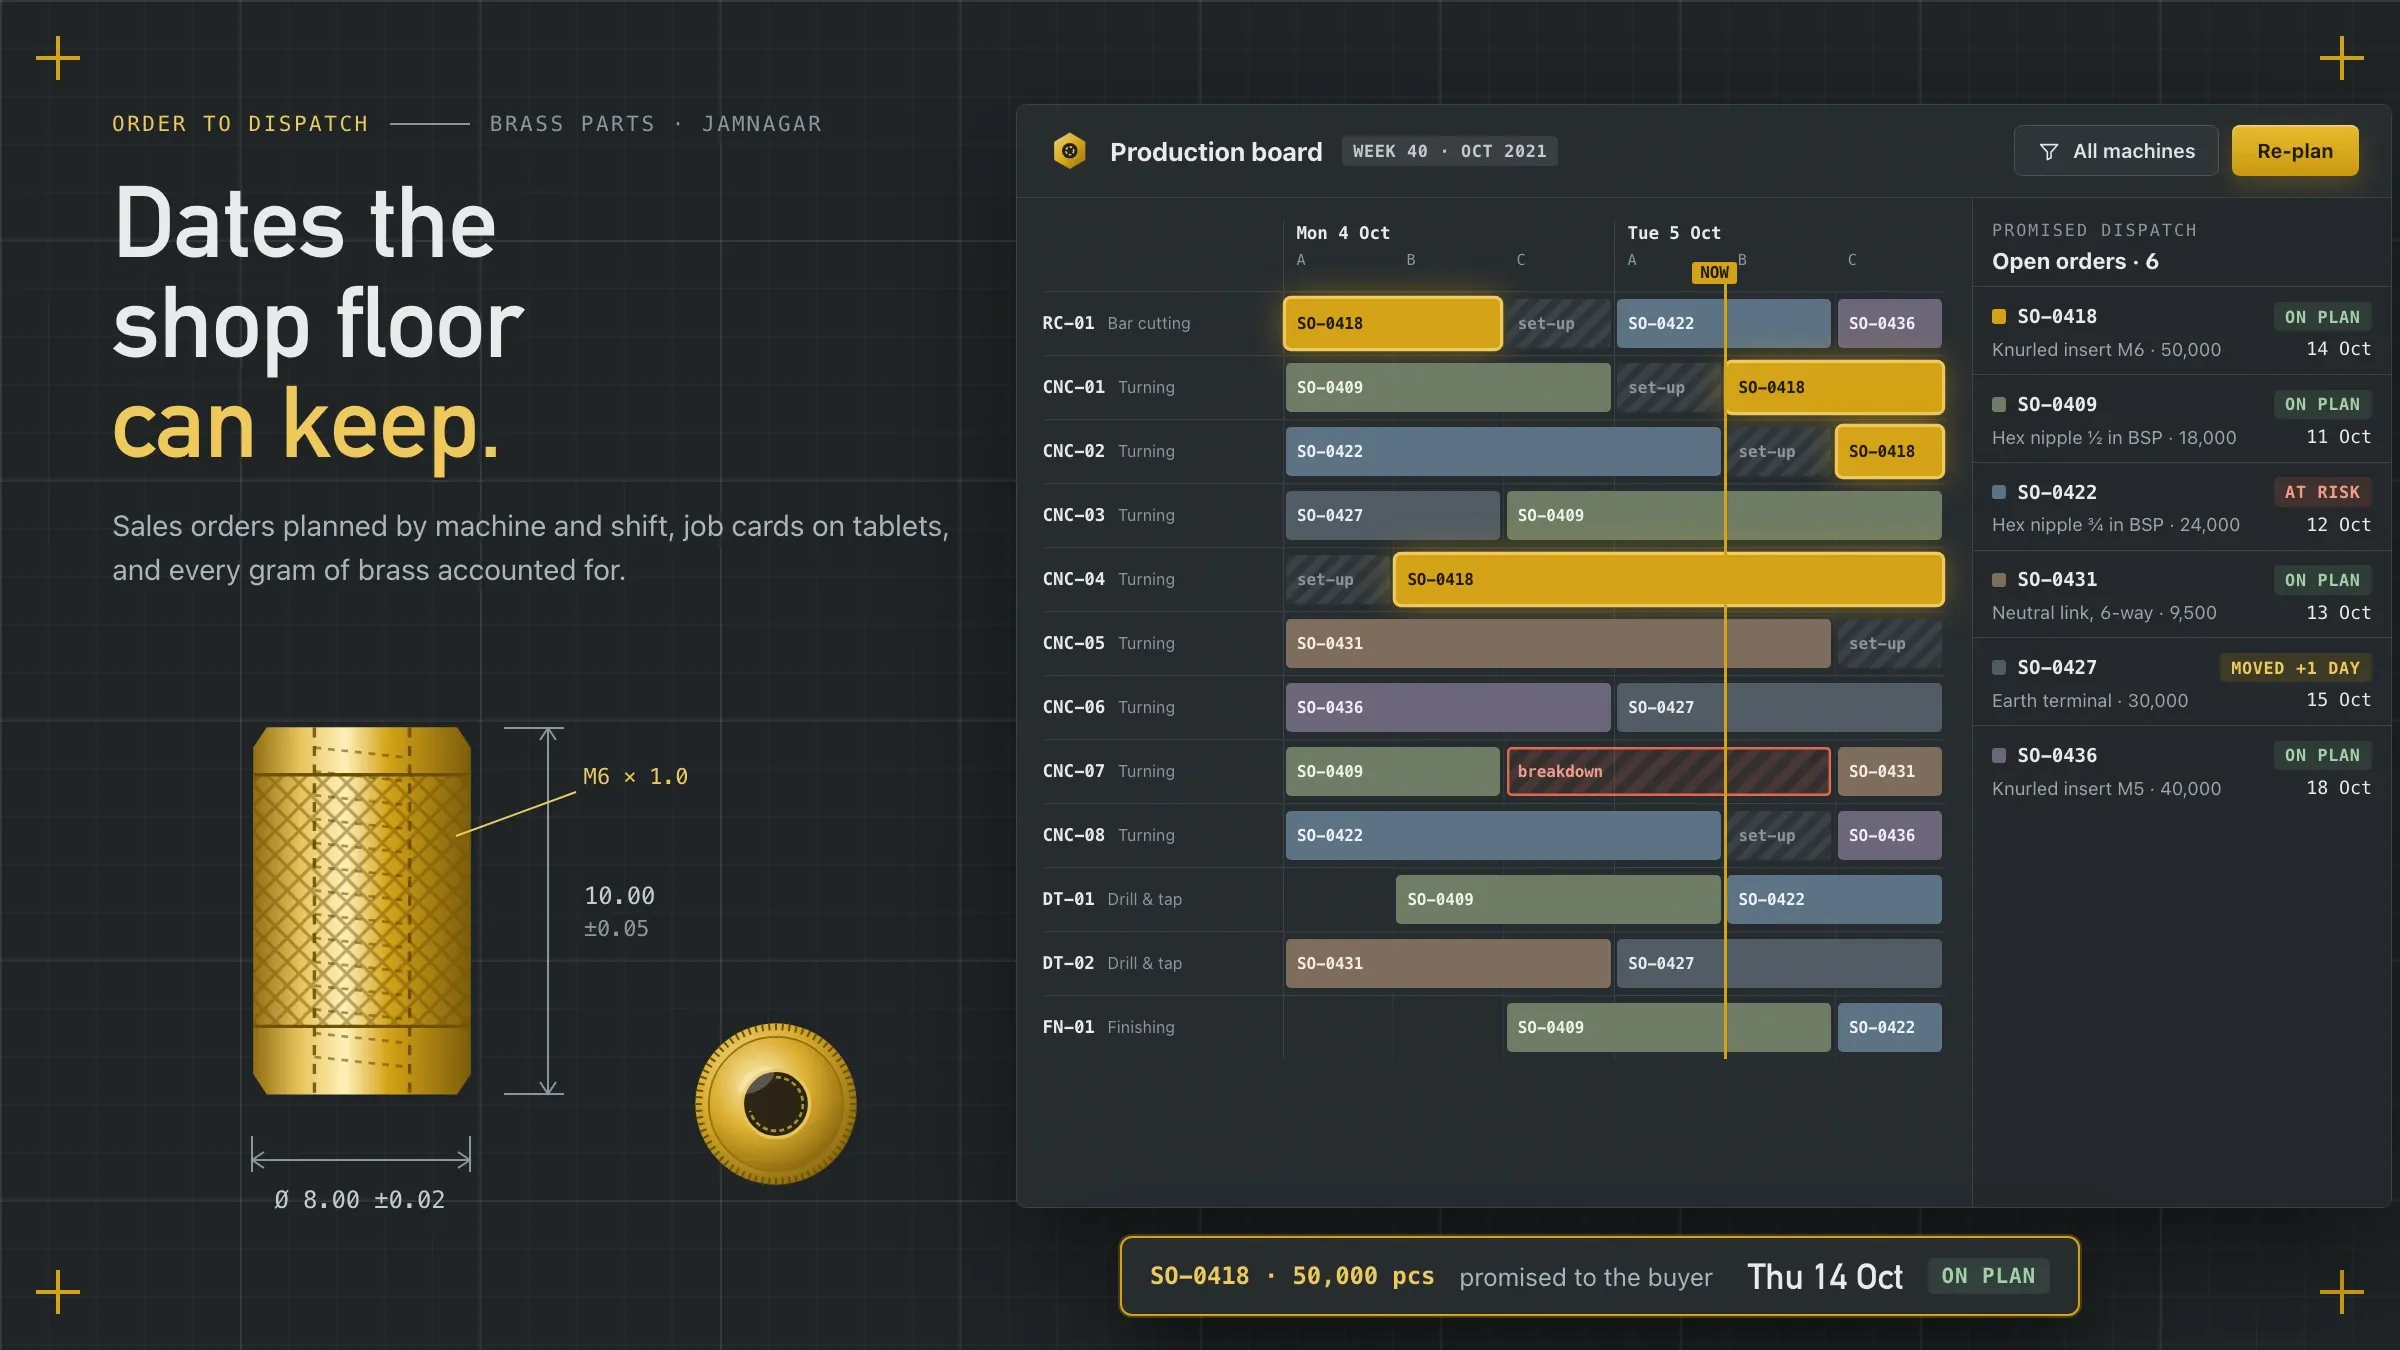 Order-to-Dispatch System Order-to-dispatch software for a brass precision components manufacturer in Jamnagar: delivery dates based on real capacity, shop-floor job cards, brass yield and scrap tracked to the gram, job work challans, and e-invoices straight from dispatch.
Need something like this built?
Tell us what you want to build and where you are with it, and we'll get back to you.
Start a project