Make it work better business intelligence dashboards
See your whole business on one screen
We connect the tools your business already runs on, define every number once and build dashboards each team actually uses, so sales, margin, stock and cash sit on one screen and every figure agrees.
- Every number defined once, in writing
- Checked against your accounts before launch
- Answers with the working shown

Sound familiar?
What we hear before we start
- Every Monday someone exports files and rebuilds the same spreadsheet.
- Sales, marketing and finance bring different numbers to the same meeting.
- You can see revenue, but not what each product earns after ads, fees and returns.
- Stock-outs are noticed after sales have already stopped.
- Questions wait in a queue for the one person who knows the spreadsheets.
- You already have dashboards. Nobody trusts them, so nobody opens them.
What changes
-
Today: Reports are rebuilt by hand every week.
After: Data arrives from every tool on its own, daily or more often.
-
Today: Each tool counts revenue its own way.
After: Each number has one written definition, used everywhere.
-
Today: Profit is known only at month end.
After: Margin per product and channel is visible every day, after every cost.
-
Today: Problems are found after they have cost money.
After: Alerts arrive while there is still time to act.
-
Today: Questions wait for the analyst.
After: Anyone asks in plain English and sees the figure with the query behind it.
What it does for you
-
Connect every source
Your store, marketplaces, ad platforms, CRM, accounting software, warehouse system and spreadsheets, synced into one data warehouse automatically.
For exampleAmazon, the online store and Google and Meta ads land in one place every morning, with time zones and currencies matched.
-
One definition per number
Net revenue, contribution margin, acquisition cost and stock cover defined once, in writing, and calculated the same way everywhere.
For exampleFinance and marketing open different dashboards and see the same net revenue.
-
A dashboard for each team
Leadership, sales, marketing, operations and finance each get views built around the decisions they make.
For exampleOperations opens a list of products heading for a stock-out, most urgent first.
-
Profit you can see
Contribution margin by product, order, channel and customer, after cost of goods, fees, shipping, returns and ad spend.
For exampleA best-seller turns out to lose money after returns and ads, and its price is reviewed.
-
Alerts before it's too late
Warnings when stock runs low, spend jumps, margins slip or a source fails to send its data.
For exampleA source fails to sync overnight, and the team is told before anyone reads a wrong number.
-
Ask in plain English
An AI analyst answers from the defined numbers, with the figure, a chart and the query it used.
For exampleThe owner asks in Slack how the festive sale compared with last year and gets a chart back.
-
A summary that writes itself
A short weekly note on what moved, what to watch and where to look, sent to the people who need it.
For exampleEvery Monday morning, leadership reads a one-page note instead of opening a spreadsheet.
How it works
-
Agree the numbers
We write one definition for each number the business runs on.
-
Connect the sources
Each tool syncs into one data warehouse on a schedule.
-
Model and test
Definitions become tested code, checked for missing, duplicated or late data.
-
Build the views
Each team gets dashboards built around its own decisions.
-
Check against the books
Figures are matched to finance's month-end numbers before launch.
-
Ask and act
People ask questions, get alerts and act on the same numbers.
Where we've built it
5 from our portfolio
-
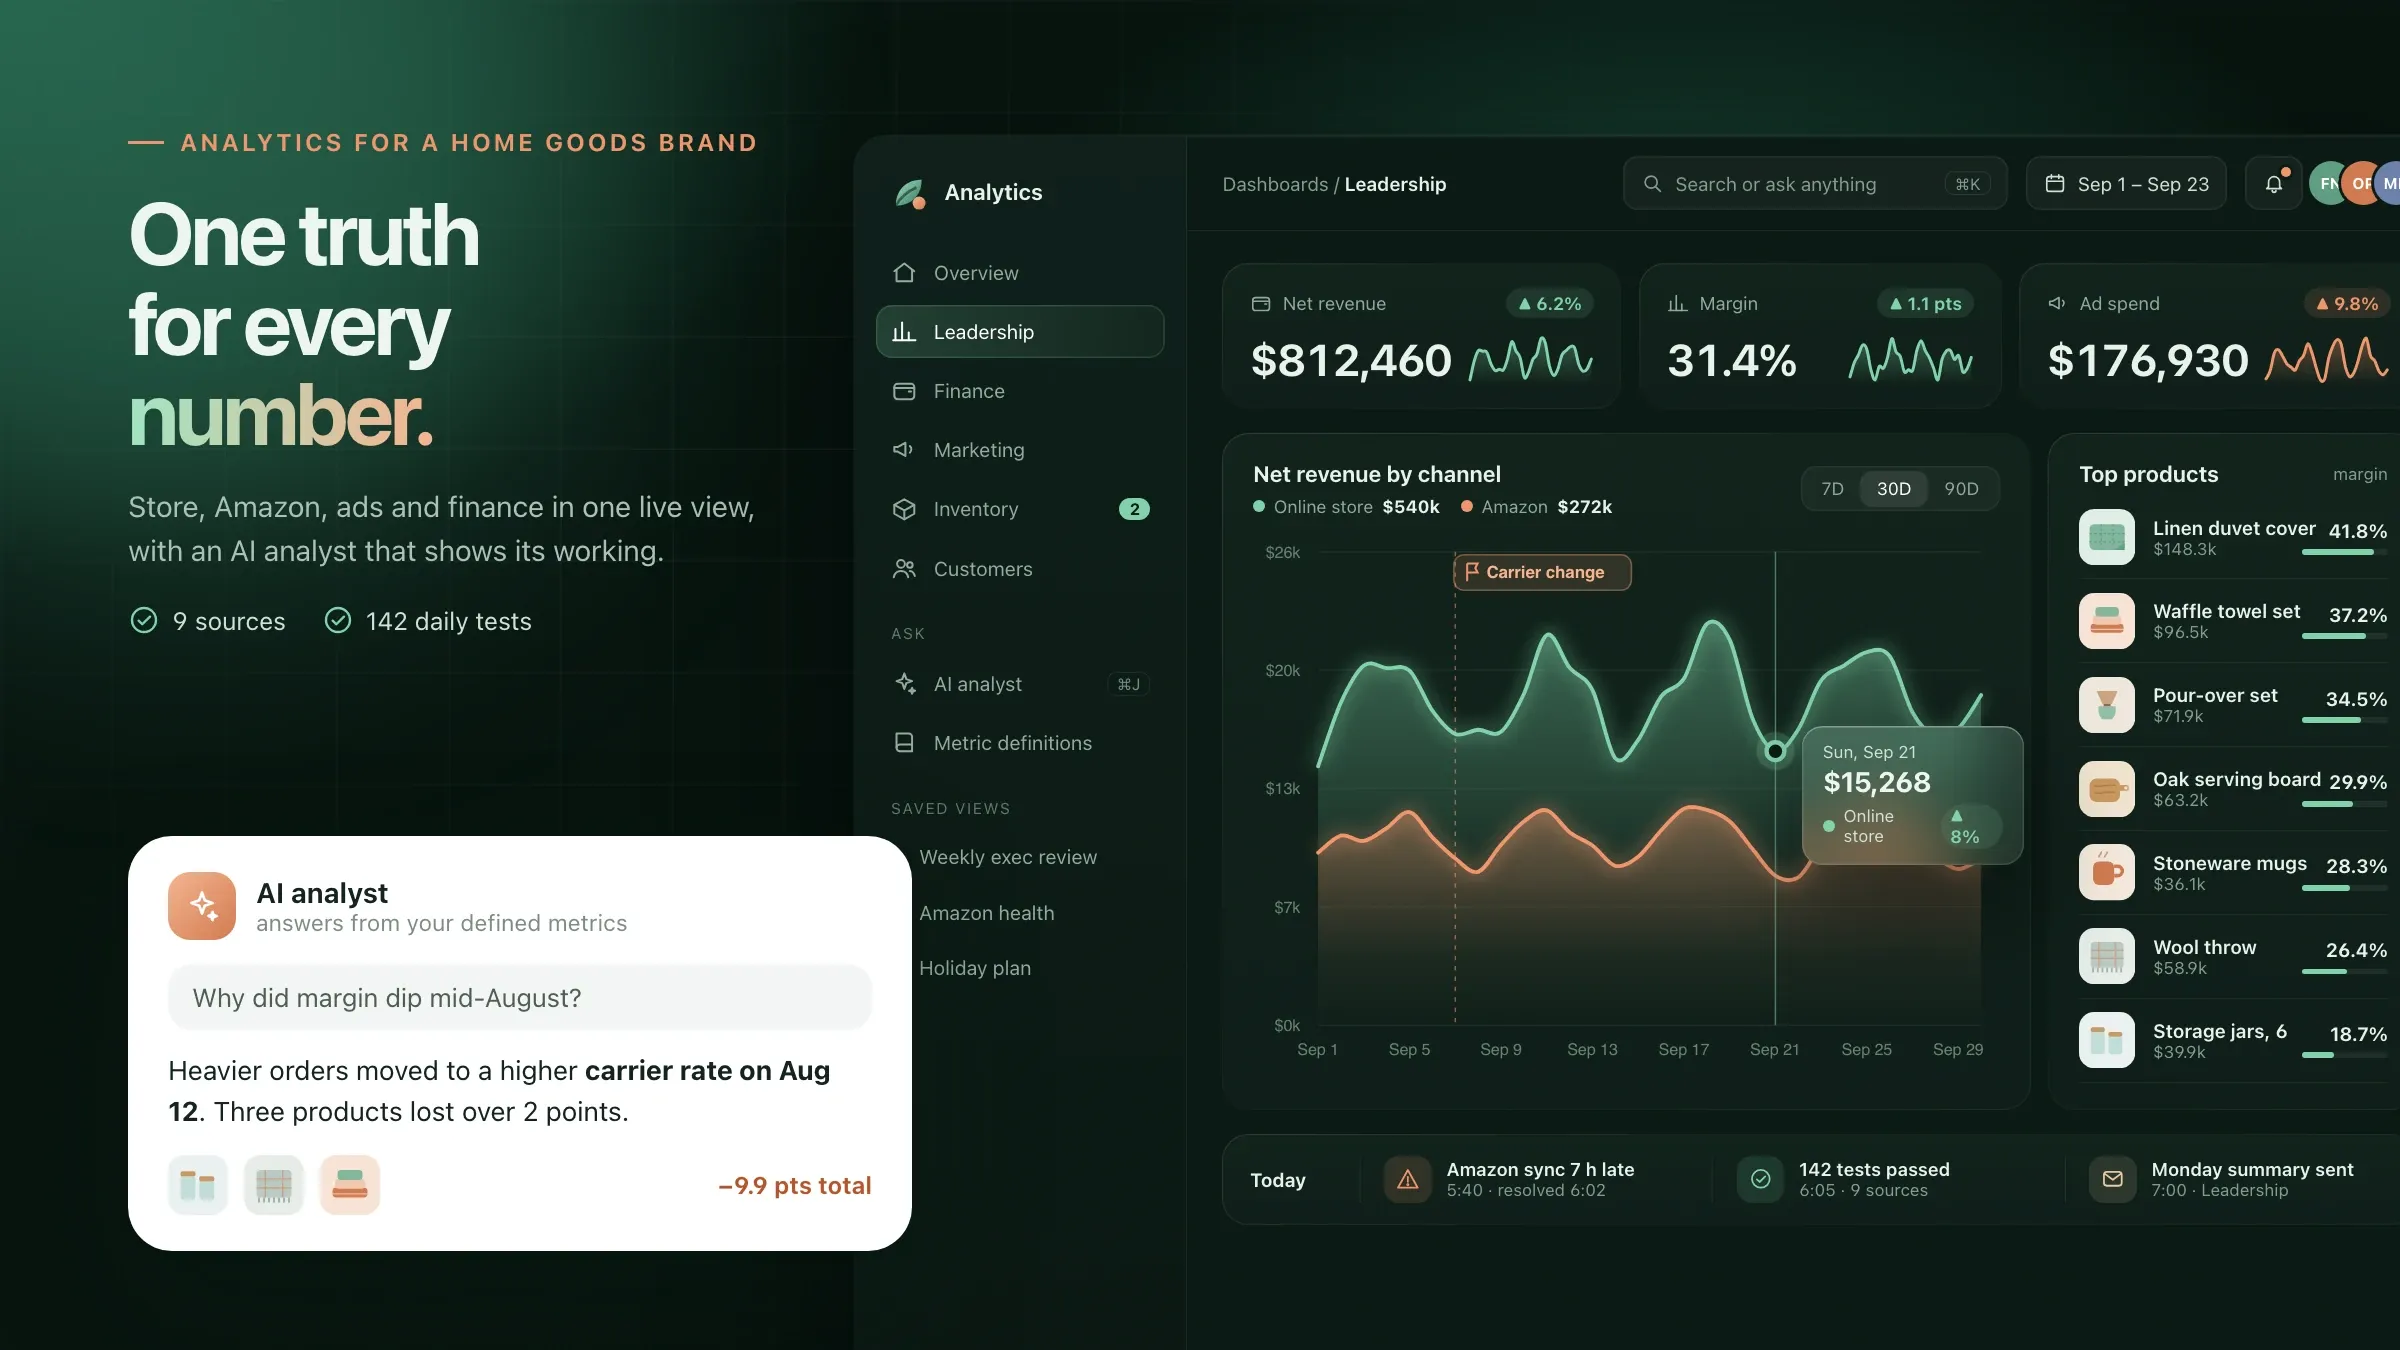 Every team on the same numbers For a home goods e-commerce brand in Denver, store, Amazon, ads, email, warehouse and accounting data meet in one warehouse, with dashboards for each team and AI answers. Read the case study
-
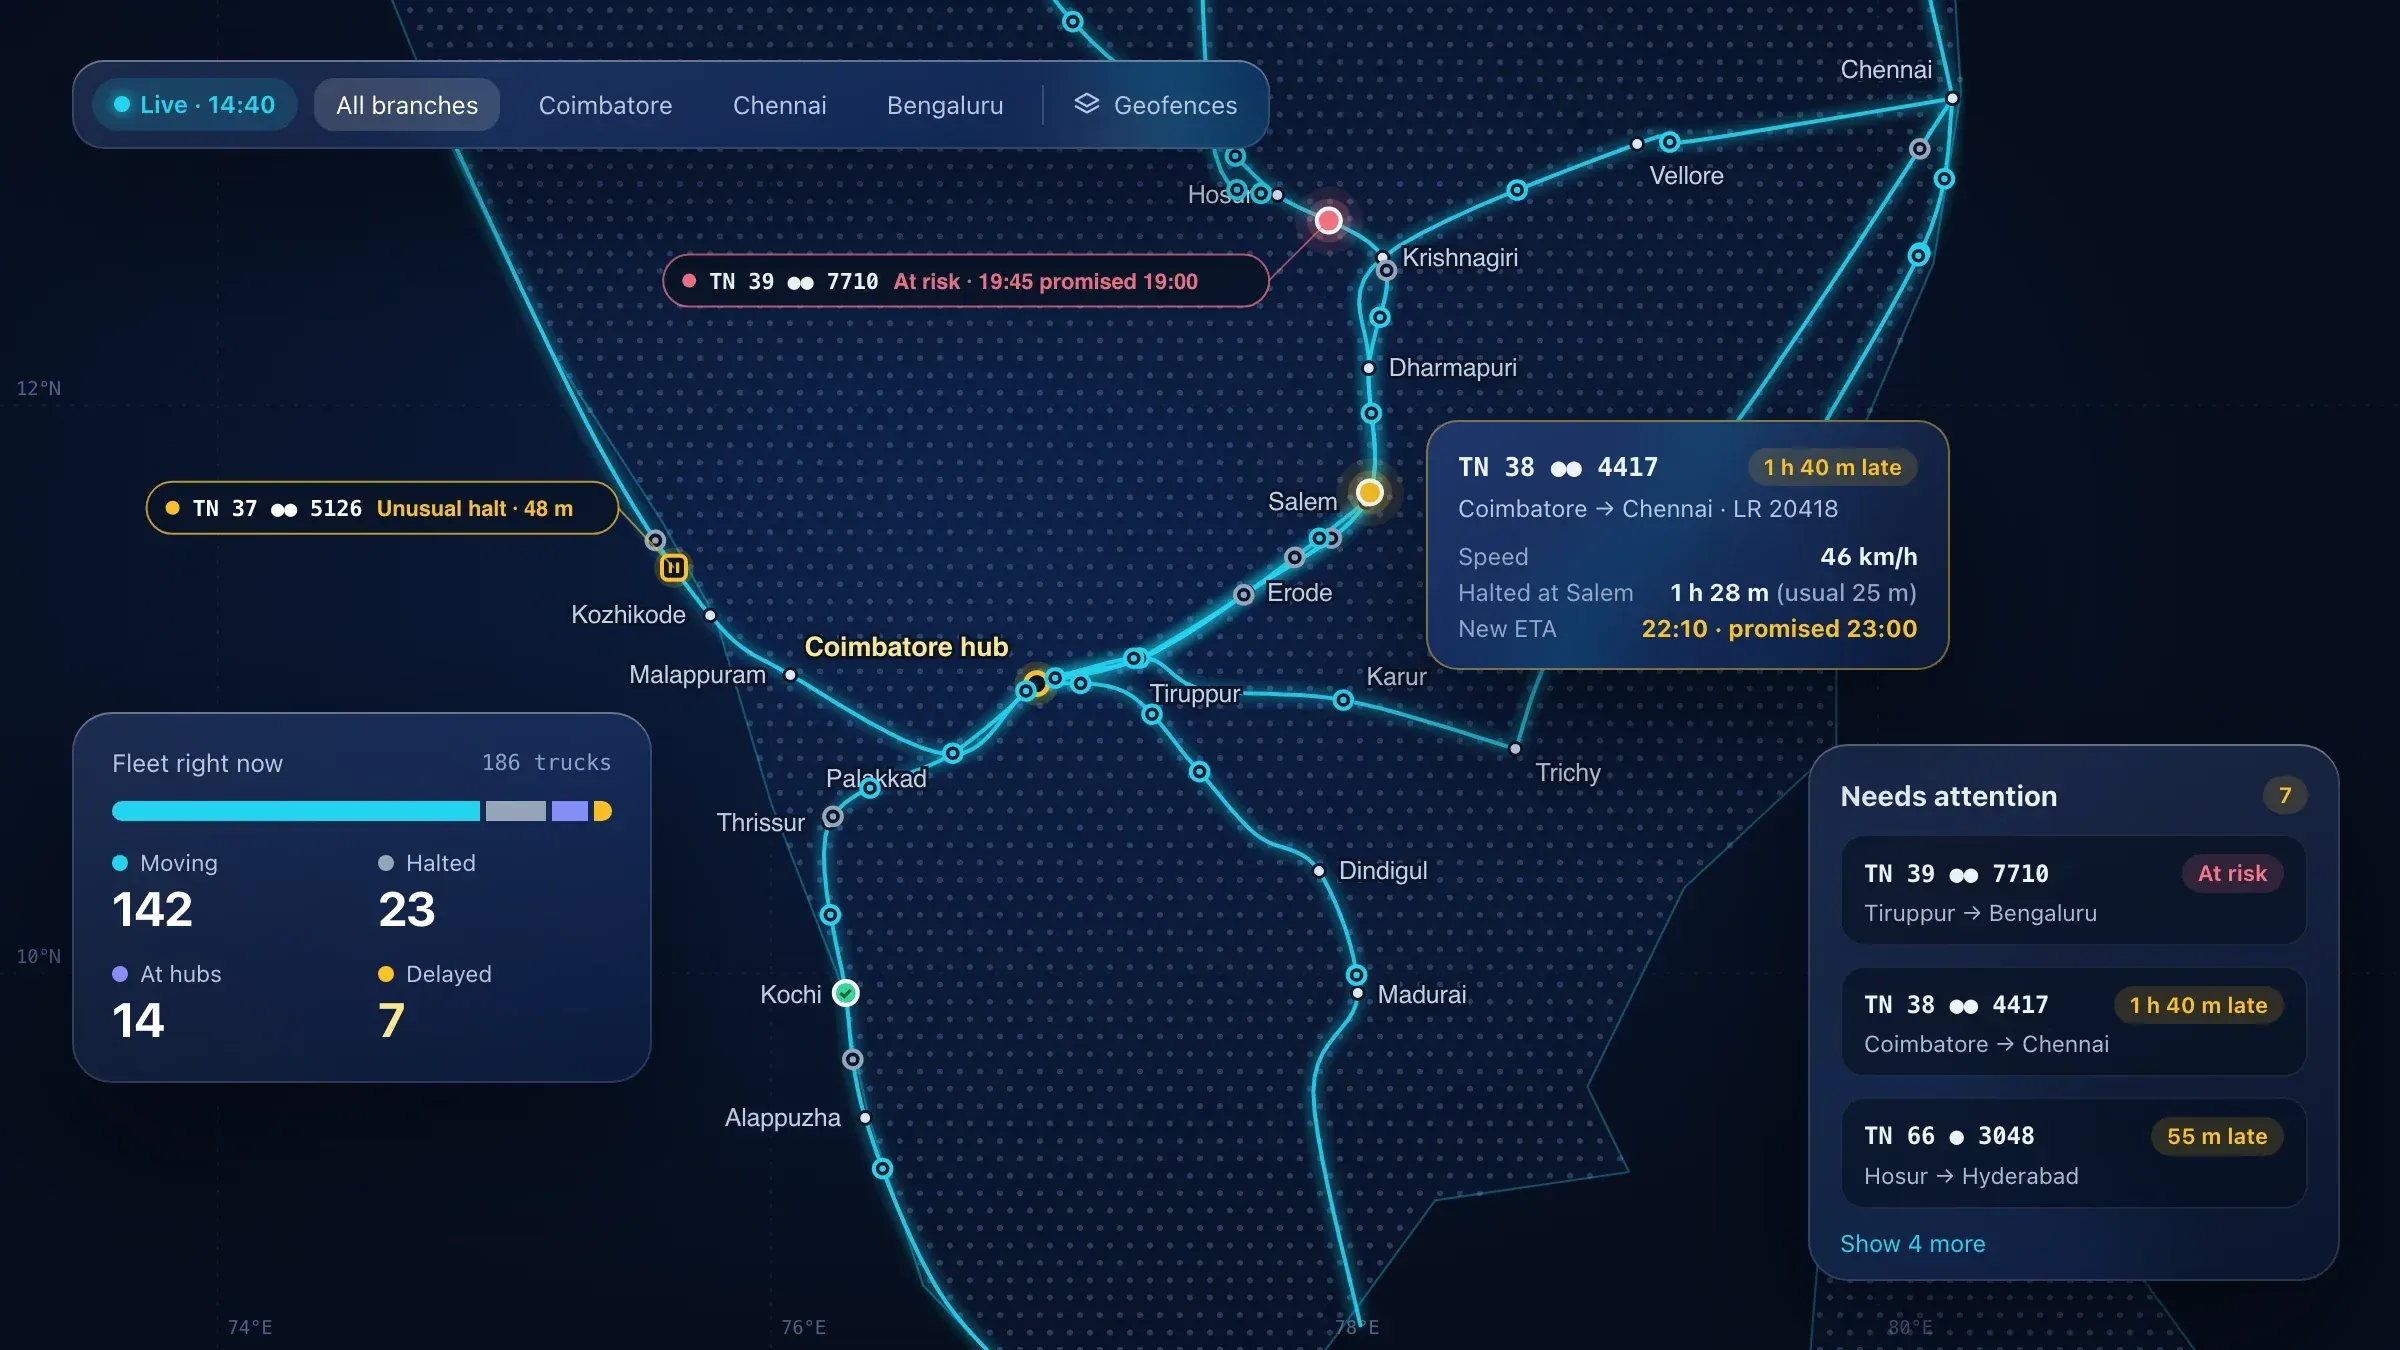 The whole fleet on one live map For a transport company in Coimbatore, every truck, trip and consignment is on one live map, with delay alerts that learn each route's normal pace. Read the case study
-
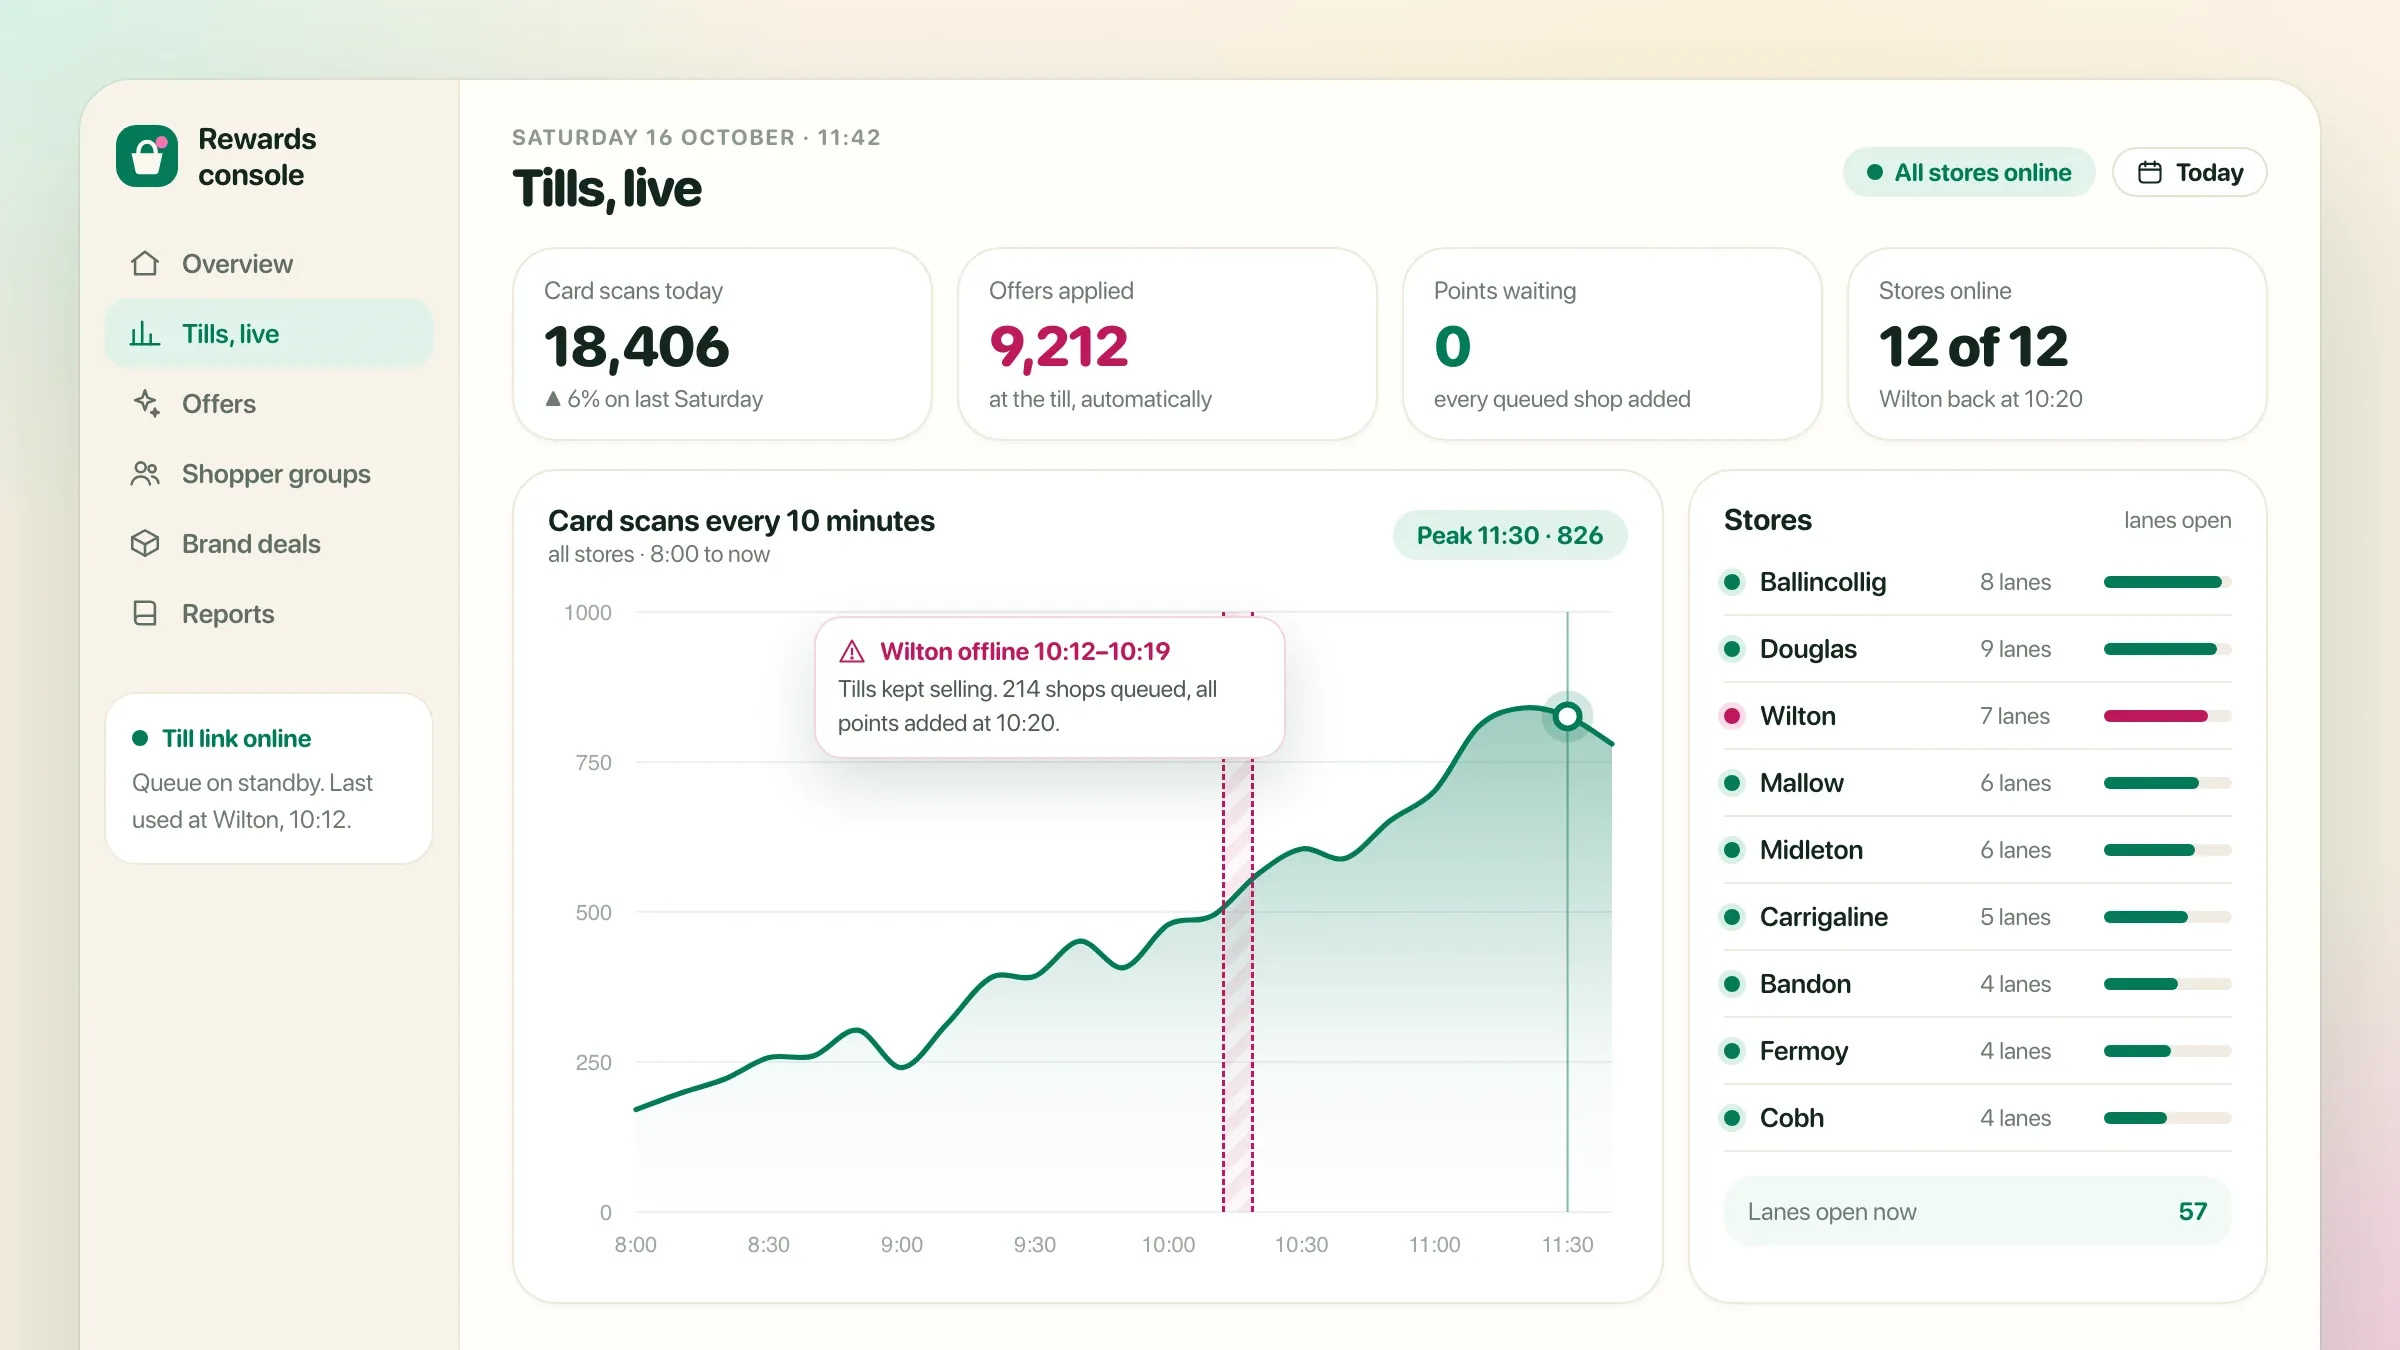 Which offers work, store by store For a supermarket chain in Cork, Ireland, the marketing team sees which offers were activated and used in each store, with shopper groups built in BigQuery. Read the case study
-
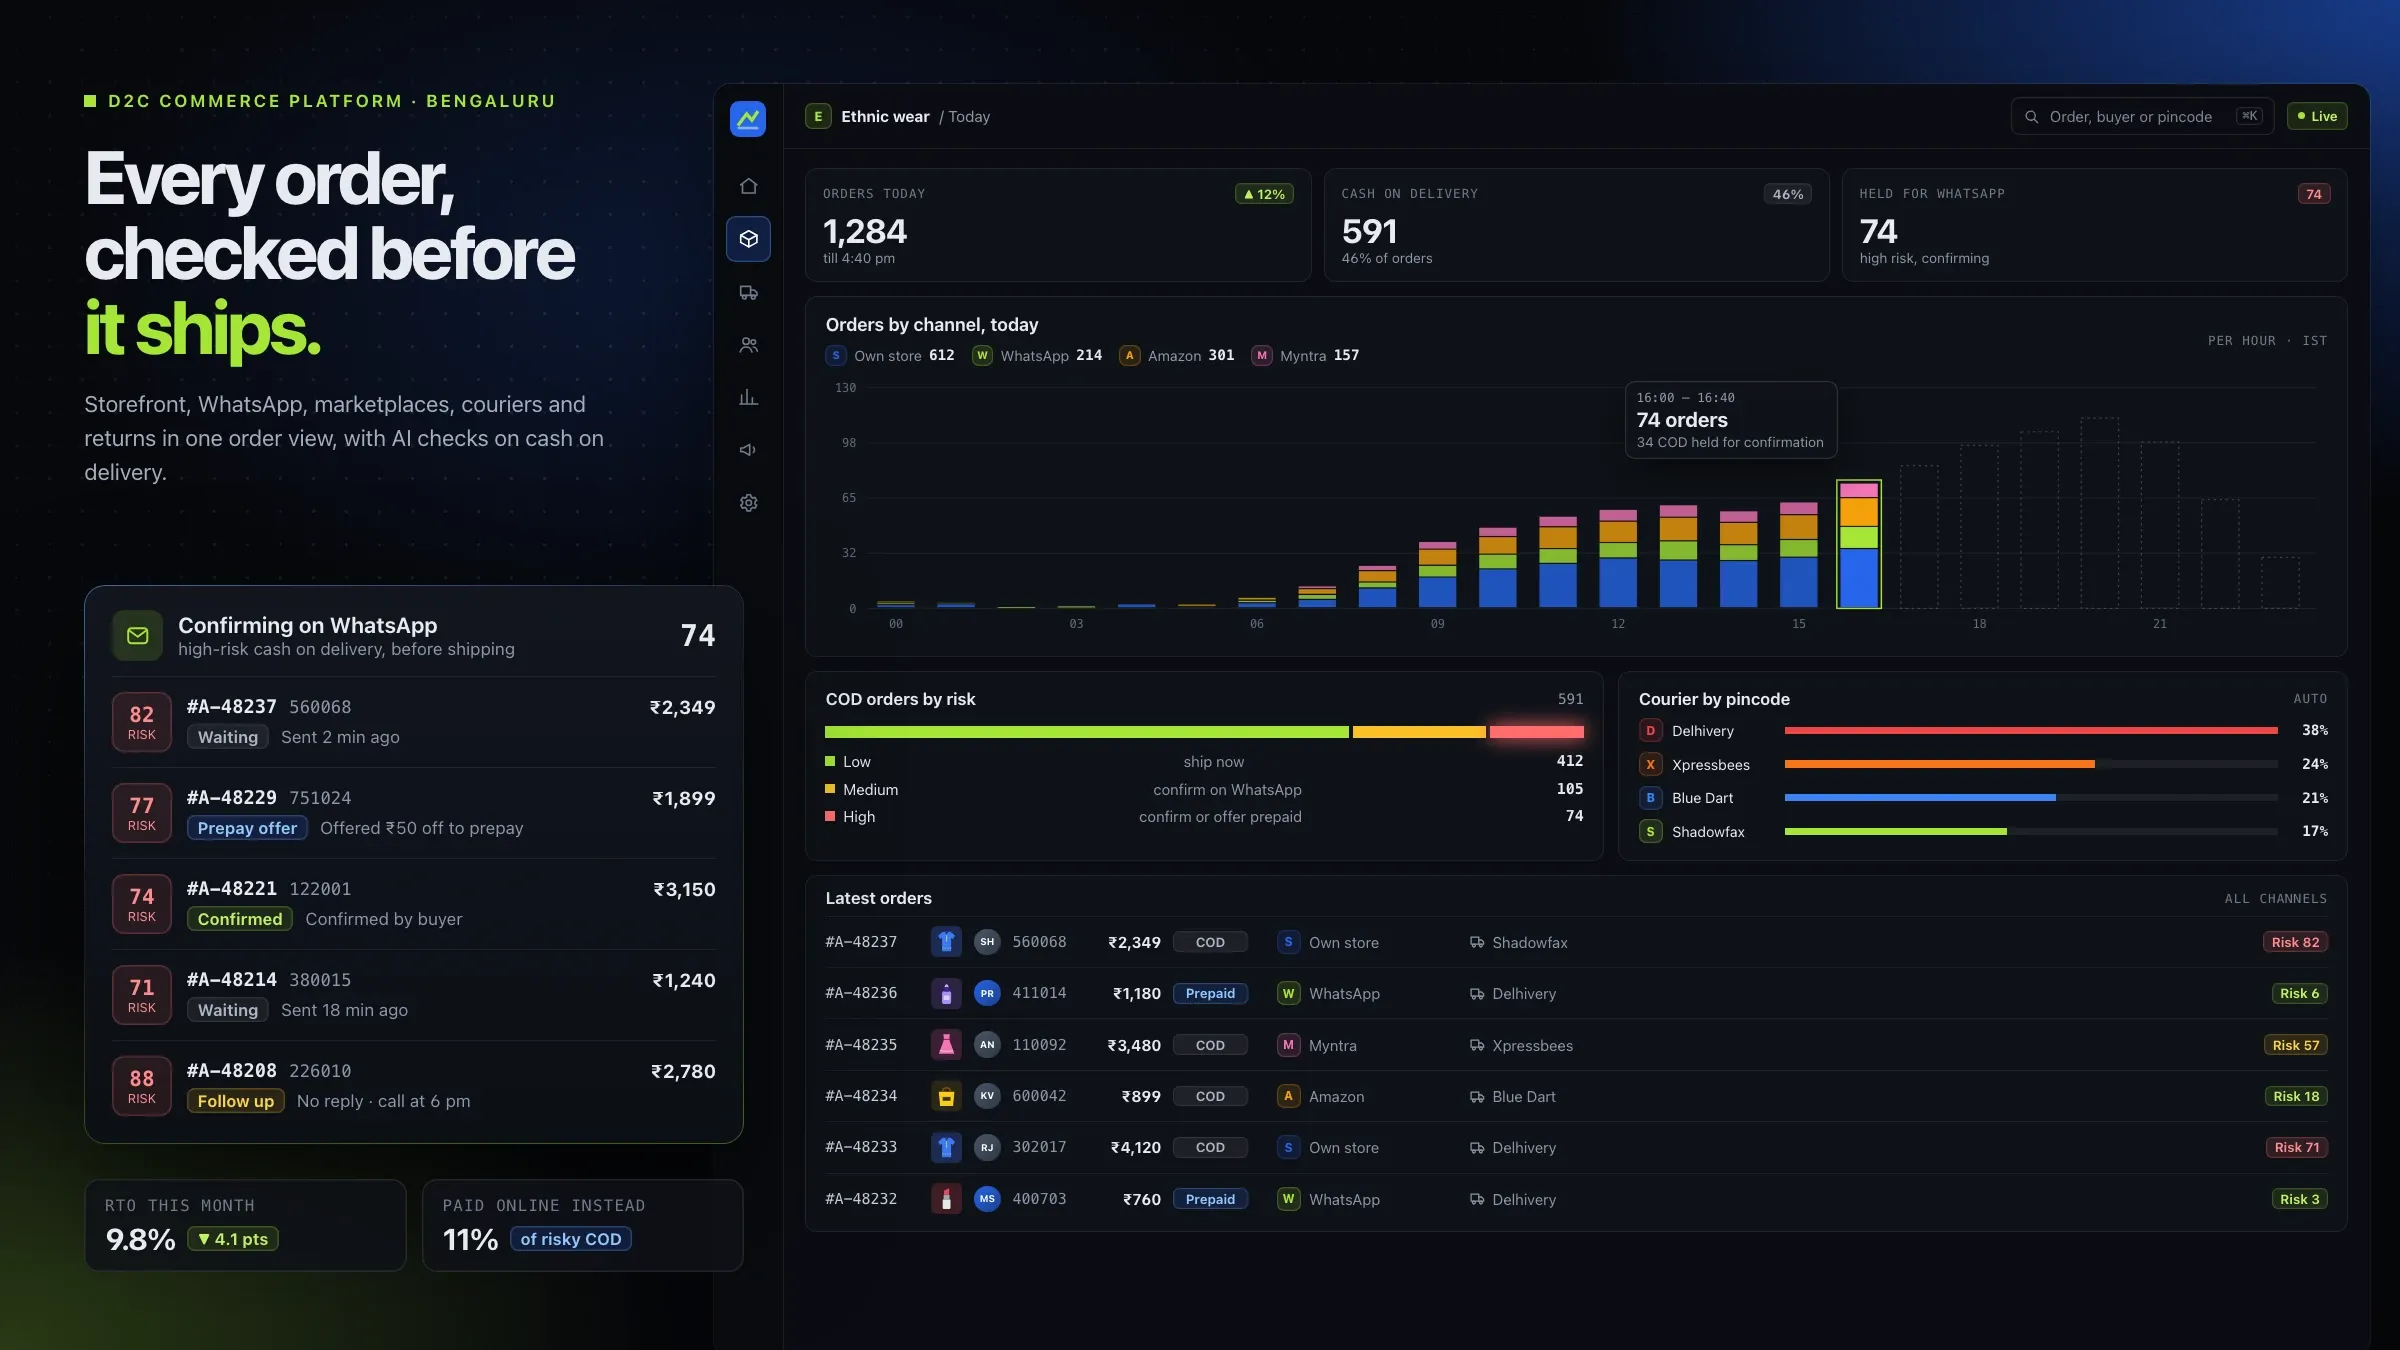 Return rates by pincode and courier For a Bengaluru commerce platform for D2C brands that we back, we built analytics that show return rates by pincode, courier and product. Meet the startup
-
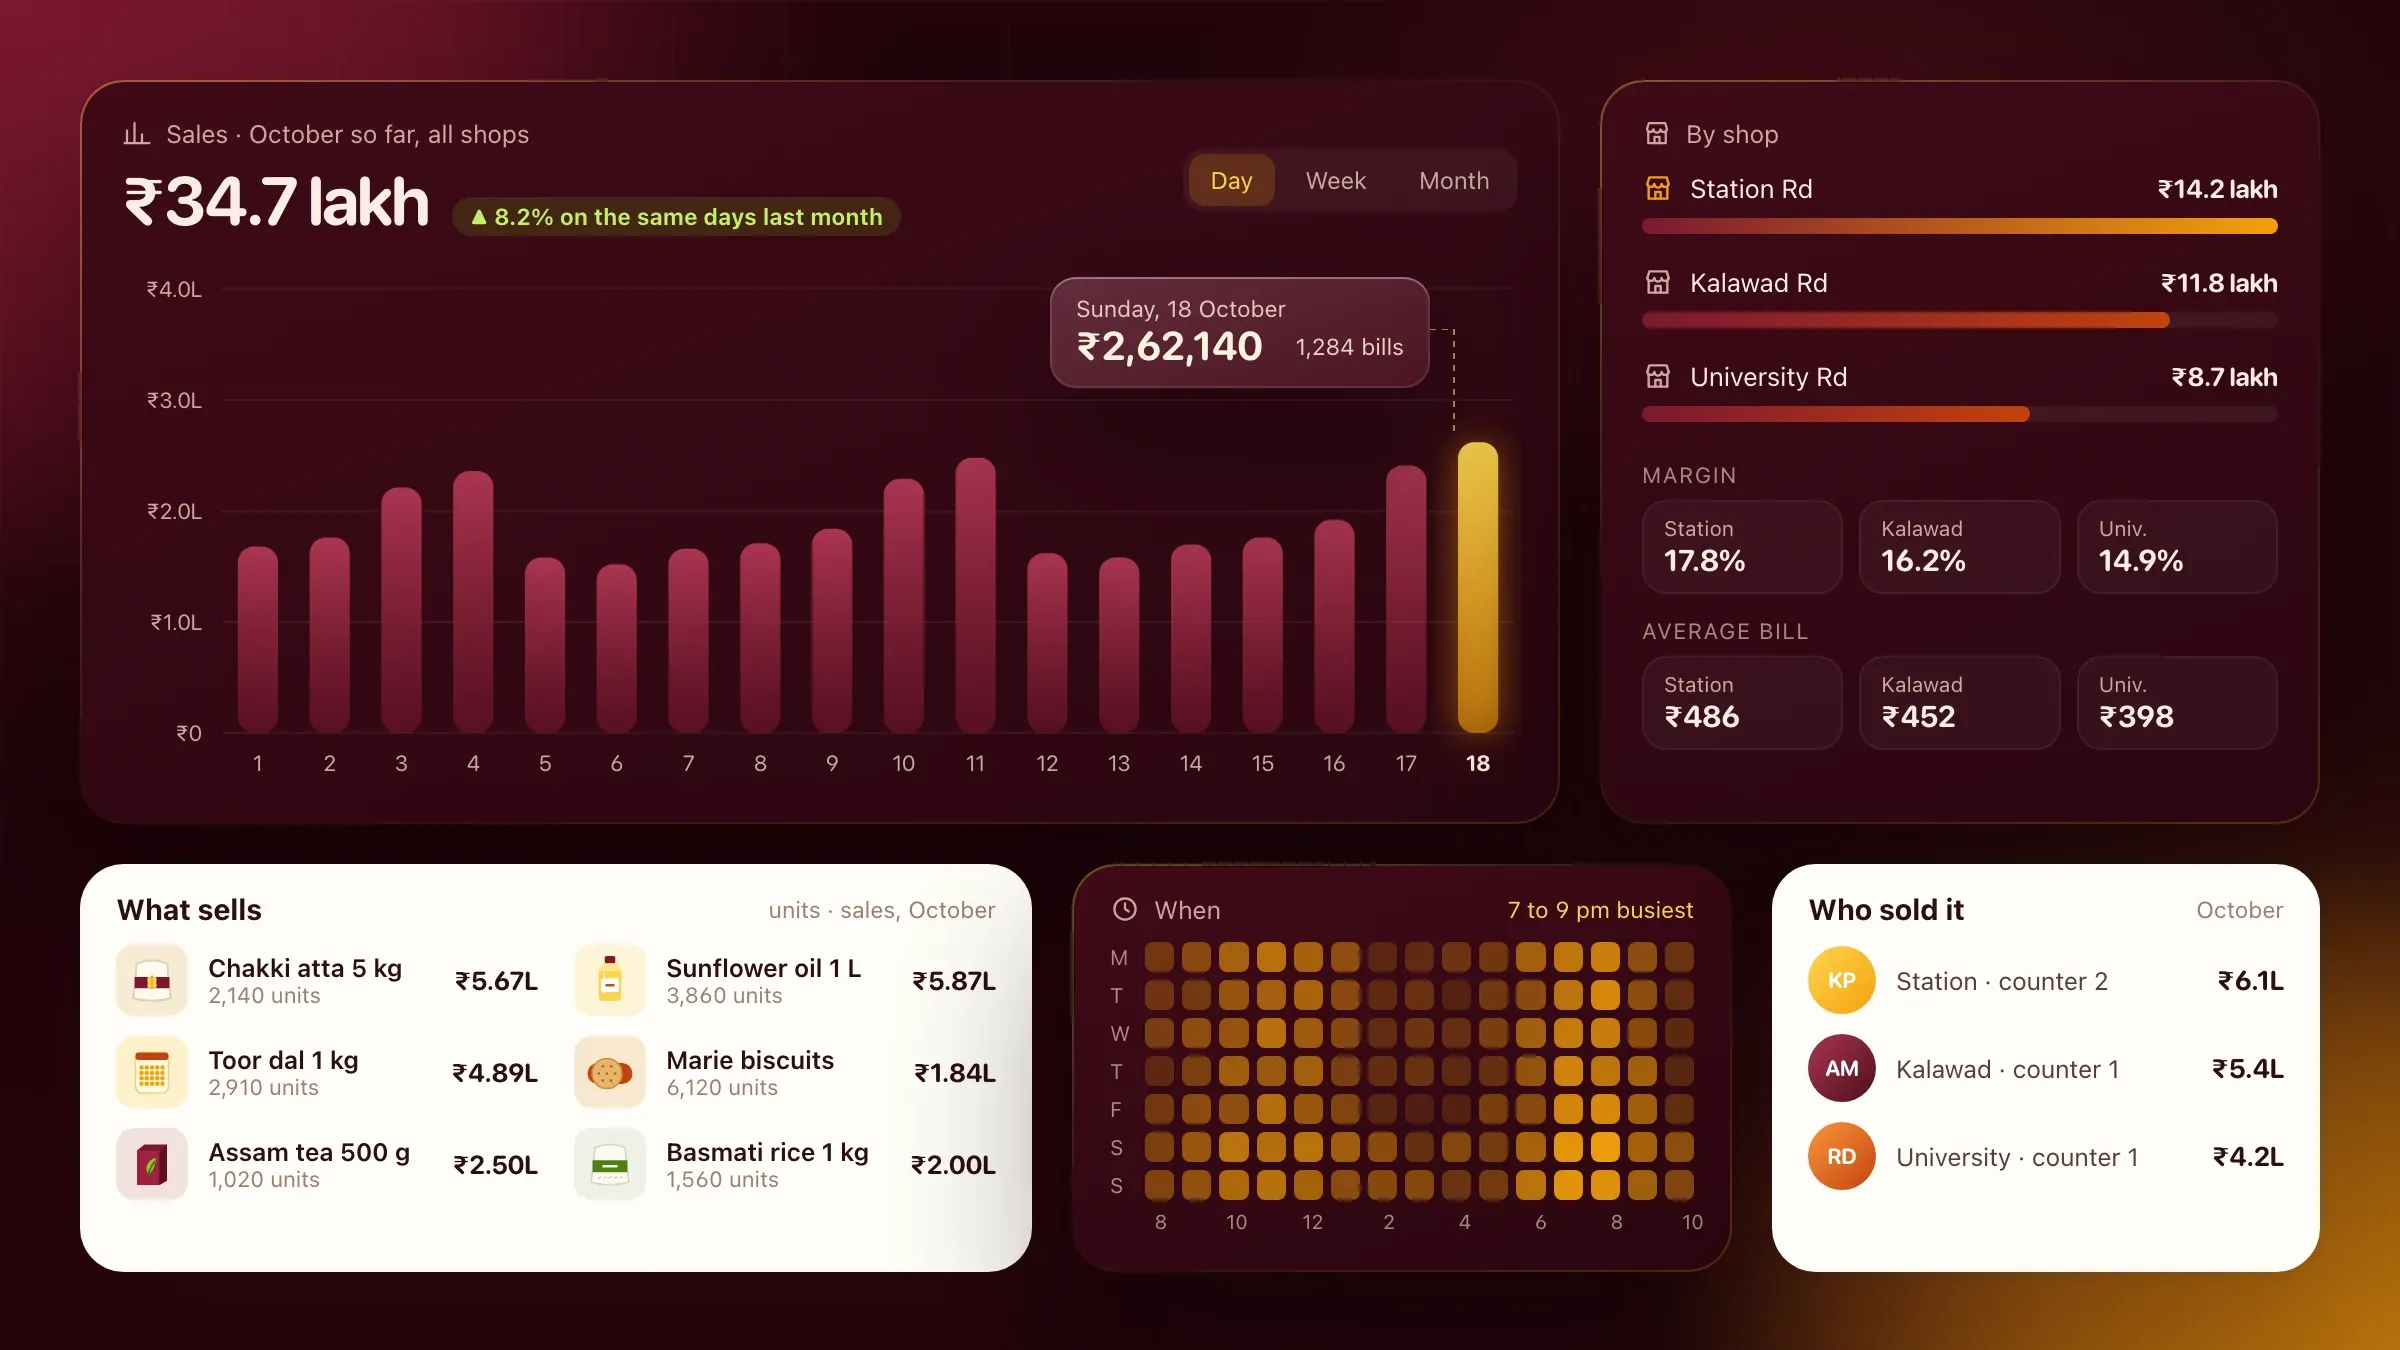 What sells, where and when In Ember POS, our own inventory and billing software in development, owners see what sells, where and when, and what each shop earns. See the product
What a BI dashboard is for
A business intelligence dashboard puts the numbers your business runs on in one place, up to date and agreed by everyone. Sales, margin, spend, stock and cash stop living in separate tools and separate spreadsheets.
The point is not more charts. It is faster, better decisions: which product to push, which campaign to cut, what to reorder, which customer is slipping. A good dashboard answers the questions a team asks every week before anyone has to ask them, and makes the next question easy to answer too.
Dashboards also help the people who aren’t analysts. A store manager, a sales head or a founder on the move can see where things stand without asking anyone, on a laptop or a phone.
Why your numbers don’t agree today
Numbers disagree because every tool counts in its own way. Your store counts revenue before refunds; your accounts count it after. Amazon reports in its own time zone. Google and Meta each claim credit for the same sale. The warehouse counts stock that the store has already sold.
So every Monday someone exports files and stitches them together, and the meeting starts with an argument about whose figure is right. A Denver home goods brand we built for had exactly this: its numbers lived in eight places, and they never agreed.
Adding another dashboard on top of that mess doesn’t help. The fix starts underneath.
What we need from you
We need view-only access to your tools, an hour or two with each team, and one person who owns the numbers.
Access means a view-only login or API key for each source: the store, marketplaces, ad accounts, analytics, the CRM, accounting and any warehouse or ERP system. The hours with each team are for the decisions they make and the questions they keep asking. One person on your side, often the finance head or a founder, settles definitions when two teams disagree, and signs them off.
It also helps to bring the spreadsheets people use today. They show which numbers matter, how they are worked out now, and where the gaps are.
Metrics first: one definition for every number
Before connecting a single source, we agree what each number means and write it down. We talk to leadership and each team, list the decisions they make and the numbers behind them, and settle the details: is net revenue before or after returns, what counts as a new customer, which costs sit inside contribution margin.
Typical definitions include net revenue, contribution margin per order and per product, marketing efficiency, customer acquisition cost, lifetime value, days of stock cover and cash collected. Each gets one written definition that finance, marketing and operations sign off.
Definitions also settle the awkward edges: how a part-refunded order counts, which day a late-night order belongs to, how a bundle’s revenue splits across its products, and what happens to cash-on-delivery orders that come back undelivered.
This step takes judgement more than code, and it is the step that makes everything after it trusted.
Where the data comes from
Your data stays in the tools you already use; we copy it, on a schedule, into one data warehouse. Typical sources are online stores and marketplaces, Google and Meta ads, Google Analytics, your CRM, Tally or other accounting software, an ERP or warehouse system, payment gateways and the spreadsheets nobody has replaced yet.
Most sources sync daily, and fast-moving ones such as ad spend can sync every few hours during a sale. Time zones, currencies and product codes are matched on the way in, so a day, a rupee and a product mean the same thing in every source. Tools without a ready connector are reached through their API or a scheduled export.
We read with read-only access wherever a tool allows it, so reporting can never change your live systems.
We choose the tools to suit your size and budget. A typical setup is a sync tool such as Airbyte, a warehouse such as BigQuery, models written in dbt and dashboards in Metabase or Looker Studio. Smaller businesses can start lighter, and the definitions and tests stay yours whichever tools you use.
Testing the numbers before anyone trusts them
Every definition becomes a model in code, written once and used by every dashboard, report and AI answer. Each model has tests for missing, duplicated or late data, and when a source fails to sync or a figure looks wrong, the team is alerted before anyone reads it.
Before launch, every dashboard is checked against finance’s month-end figures until they match. That reconciliation is what turns a dashboard from something people glance at into something they act on. Every figure also links to its written definition, so anyone can see exactly what it includes.
Dashboards built around decisions
Each team gets views built around what it decides, not a single page of everything:
- leadership: a daily snapshot of sales, margin and spend by channel, with this week against the last;
- sales: pipeline, orders and collections by salesperson, region and customer;
- marketing: spend and return by channel and campaign, new against returning customers, and acquisition cost;
- operations: stock cover, inbound shipments and products at risk of running out;
- finance: profit and loss by channel each month, reconciled to the accounts.
Each view starts with the question it answers, shows the few numbers that answer it, and lets people click through to the orders, products or campaigns behind any figure. A few clear views get opened every day; a wall of charts doesn’t.
Alerts sit beside the dashboards: low stock, spend that jumps, margin that slips, a source that stops sending data. They go to the person who can act, while there is still time.
Where it pays off first
The first wins usually come from margin and stock. Margin per product, after cost of goods, fees, shipping, returns and ad spend, can show that a best-seller earns far less than its revenue suggests, or nothing at all. Stock cover by product and location turns stock-outs from a surprise into a warning.
The third win is time. When the Monday spreadsheet retires, the person who built it gets their week back.
Operational views pay off the same way. A transport company we built for in Coimbatore runs its whole fleet from one live map, where delay alerts that know each route’s normal pace give dispatchers time to act. A supermarket chain we built for in Cork sees which offers were activated and used, store by store.
Asking in plain English
Not every question deserves a dashboard. For the rest, an AI analyst lets anyone ask in plain English, in Slack or in the dashboards: which products lost margin last month and why, or how this festive sale compared with last year’s.
It answers from the same defined numbers, with the figure, a chart and the query behind it, so every answer can be checked. It follows the same access rules as the dashboards, and when the data to answer doesn’t exist, it says so instead of guessing. Each Monday it can also write a short summary of the week for leadership: what moved, what to watch and where to look.
After launch: keeping it right
Dashboards drift if nobody looks after them. Tools change their exports, new products and channels arrive, and definitions need updating as the business grows.
We keep the data flowing and the tests passing, add sources and numbers as you need them, and review which dashboards people actually open. Views nobody uses are removed; questions people keep asking the AI become new views. At handover each team learns to filter, drill down and save its own views, and one person learns to add a new number the right way, with its definition and tests. We stay on hand on India time for the harder changes.
How we work with you
From the first call to running it
- Start
Agree what each number means
We talk to leadership and each team, list the decisions they make and write one definition for every number they need.
- Build
Connect, model and test
We sync your sources into one warehouse, turn the definitions into tested models and build the first dashboards.
- Pilot
Check against the books
Each team uses its dashboards beside the old reports, and we reconcile every figure with finance until they match.
- Launch
Retire the spreadsheets
The weekly spreadsheets stop, alerts and the AI analyst switch on, and your team learns to add its own views.
- Every month
Keep it right
We watch data quality, add sources and numbers as the business changes, and review which dashboards people use.
Safe and in your control
Each person sees what they should
Access follows roles, so someone who can't see finance data can't get it from a dashboard or by asking the AI.
Tested every day
Every model is tested for missing, duplicated or late data, and failures alert the team before anyone reads a wrong number.
Read-only connections
We read from your tools with read-only access wherever they allow it, so reporting can't change your live systems.
The working is shown
Every AI answer shows the query it used, and every dashboard figure traces back to its written definition.
An AI that doesn't guess
When the data to answer a question doesn't exist, the AI analyst says so instead of making something up.
Your data stays yours
The warehouse can sit in your own cloud account, in the region you choose, and everything can be exported.
Time and cost
The cost of business intelligence dashboards depends on how many sources you have, how many numbers need defining and how many teams need their own views, not on a package. Many businesses start with a leadership view and one team, then add the rest. After the first call we send a written plan and a quote.
How many sources
Each tool adds a sync to set up and test. Tools with standard connectors are quicker than in-house systems.
How tidy the data is
Consistent records model quickly. Returns, refunds, currencies and old product codes take longer to untangle.
How many teams and views
One leadership view is quick. Separate views for every team add design and checking.
How fresh the numbers must be
Daily syncs cost less to run than syncs every few hours or close to live.
The AI analyst
Plain-English answers and weekly summaries add setup and testing on your own questions.
Running costs
Warehouse, sync and dashboard tools have their own monthly costs, which grow with your data.
Built with
Chosen for each project, never by habit
Questions and answers
12 answered
What are business intelligence dashboards?
Business intelligence dashboards bring data from every tool a business uses into live charts and tables, so teams see sales, costs, stock and performance in one place instead of building spreadsheets by hand. Done well, every figure on them is defined once and matches the accounts.
Why don't our numbers match between tools?
Because each tool counts differently. One counts revenue before refunds and another after, one uses its own time zone, and ad platforms each claim the same sale. A single written definition for each number, applied to data from every tool, is what makes them agree.
Which tools can you connect?
Most business tools: online stores, marketplaces such as Amazon and Flipkart, Google and Meta ads, Google Analytics, CRMs, Tally and other accounting software, ERPs, warehouse systems and spreadsheets. Tools without a ready connector can usually be reached through their API or a scheduled export.
Do we need a data warehouse?
For one or two sources, dashboards can read them directly. Once you have several tools, a warehouse such as BigQuery keeps a copy of everything in one place, holds the history and lets every number be defined once. It also keeps reporting off your live systems.
Which dashboard tool should we use?
Use what your team already knows if it fits. We choose the tool for your team's size, budget and skills, such as Metabase or Looker Studio. The definitions and tests underneath matter more than the tool, and they stay yours if you change tools later.
How does the AI analyst answer questions?
It turns a question in plain English into a query on your own defined numbers, then answers with the figure, a chart and the query it used. Because it uses the same definitions as the dashboards, the numbers match, and if the data to answer doesn't exist, it says so.
How do you know the numbers are right?
Every model is tested for missing, duplicated or late data, and the team is alerted when a test fails. Before launch, dashboards are checked against finance's month-end figures until they match.
How much do business intelligence dashboards cost?
It depends on how many sources you connect, how tidy the data is, how many teams need their own views, how fresh the numbers must be and whether you want the AI analyst. Starting with a leadership view keeps the first stage focused. After the first call we send a written plan and a quote.
How long does it take to build BI dashboards?
A first leadership dashboard on a few tidy sources is a matter of weeks. More sources, messier data and views for every team take longer. The written plan after the first call sets out the timeline.
Can the dashboards and answers be in Hindi or Gujarati?
Yes. Dashboard labels and the AI analyst's answers can be in English, Hindi or Gujarati, so people across the business can read and ask in their own language.
Do you build dashboards for businesses outside India?
Yes. FIRELIFE Ventures works with small and mid-size businesses worldwide, from Rajkot, India, on India time. Our portfolio includes dashboards and data work for clients in the United States, Ireland and India.
What happens after the dashboards go live?
We keep them right: we watch data quality, fix sources that break when a tool changes, add new sources and numbers as the business grows, and review which dashboards people actually use.
Tell us what should work better
Write a few lines about what slows you down today. We reply with our questions, a first plan and how we would start.
Write to us